Make It Observable: Running Grafana in Docker
We’re Earthly. We make building software simpler and therefore faster. Need to run Grafana in Docker? Earthly is your friend. It simplifies building and managing Docker containers. Give it a try.
When you have a potentially complex infrastructure, adding observability helps with easier debugging and performance optimization.
To build observability into the infrastructure, you can use Grafana, an open-source visualization and analytics platform that aids in exploring observability data, such as metrics and logs. You can run Grafana in Docker containers. This is particularly beneficial in creating an observable, portable testing environment and can be implemented in the Kubernetes infrastructure with various customizations available to the Grafana Docker container.
In this article, you’ll learn more about Grafana, its use cases, and how to implement Grafana in Docker.
Why Should You Use Grafana?

A properly instrumented infrastructure will generate a large amount of data over time that needs to be processed, stored, and utilized for debugging and optimization efforts. Grafana helps gather and process metrics, logs, and traces from various sources on a single platform. You can then run queries against the data and visualize the results. This makes data analysis easier and helps make data-backed decisions.
Grafana allows data to be explored with ad hoc queries, and offers flexible drill-down and filtering options. Dynamic dashboards and visualizations that are reusable can be created with a wide range of templates, plugins, and graphing features. With Grafana, data can be collated from mixed data sources into the same visualization; it works as an alerting tool with the ability to set rule-based alerts on metrics.
As Grafana can be utilized as a Docker container, you can better integrate monitoring and observability systems with the overall microservices infrastructure. If you already have container systems in place, you should consider deploying Grafana as a container to better fit your containerized architecture.
Running Grafana within a containerized service can help you easily create an isolated testing environment, where experiments can be created and software ideas can be tested out before pushing them to production. Moreover, because the Grafana Docker image can be easily customized, a Grafana container template that is unique to a use case can be built and can benefit from Kubernetes’s orchestrated workflows.
Implementing Grafana in Docker

Before implementing Grafana in Docker, you need to have Docker and a CLI for the commands installed. You can then set up a Grafana container using the official Grafana Docker images.
There are two managed versions of Grafana, the enterprise version and the open-source version, and they both come in Alpine and Ubuntu variants. The enterprise version offers a licensed version of Grafana with more managed features and plugins, data source permissions, and extended authorization options. However, for this tutorial, the open-source version is sufficient.
Creating a Grafana Container

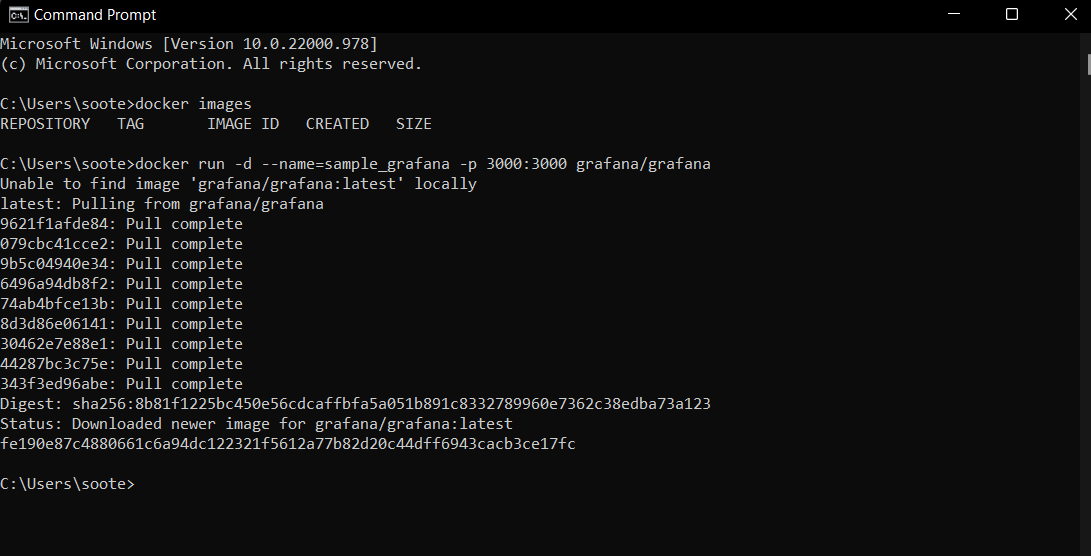
Spin up a Grafana container on a Docker-enabled CLI using the following command:
docker run -d --name=sample_grafana -p 3000:3000 \
grafana/grafana
This command tells Docker to create and start a Docker container called sample_grafana using the latest update of the official grafana/grafana Docker image (Grafana open source version). This container is then exposed through the 3000 port.
The -d tag streamlines the information visibly logged by this command:

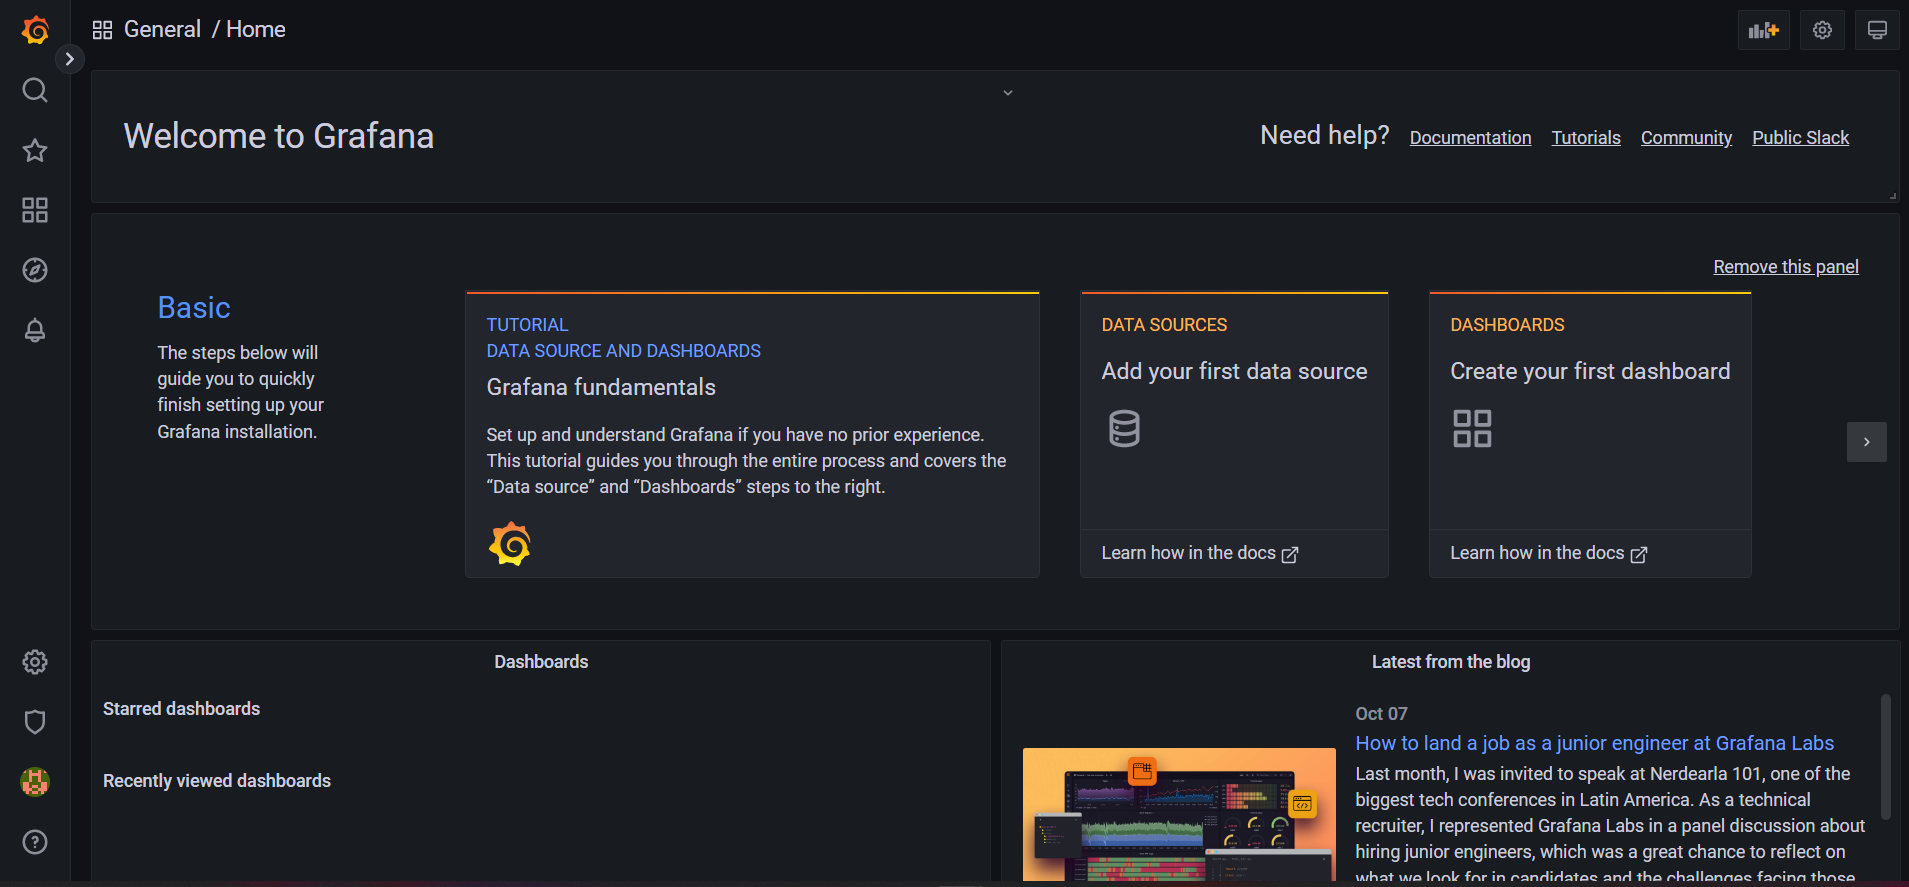
Navigate to http://localhost:3000 and access the Grafana container created. Log in with the following default Grafana authentication:
- Email or username: admin
- Password: admin
This gives access to the Grafana user interface, where you can add data sources and create visualizations:

Note: To stop and delete the running Grafana container, use the following commands, where
sample_grafanais the user-defined name tag given to the container:
docker stop sample_grafana
docker rm sample_grafana
Deploying a Grafana Container with Persistent Storage
Grafana generates information and files that are important for continuous optimization efforts and, as such, should be saved. When deploying Grafana in a Docker container, all the Grafana data gets dumped immediately after the container is stopped. To save the data from the Grafana container, you need persistent storage.
Add persistent volumes to the container during the startup process with the following command:
docker run -d --name=sample_grafana -v \
grafana-storage:/var/lib/grafana -p 3000:3000 grafana/grafana
Here, a persistent volume called grafana-storage is created and mounted on the /var/lib/grafana directory, where Grafana stores all its generated data and plugins. Because this volume and its contents are stored outside of the container, there’s no problem of losing data when the Grafana container restarts.
Note: Bind mounts can also be used to prevent data loss from the Grafana container. With bind mounts, data will be stored in a folder on the local system, and the container will depend on the host machine’s directory for its data needs. This is ideal if full control of the storage option is required and other tools (besides Docker) need to be given read-and-write access to the storage.
Configuring a Grafana Container
Generally, Grafana offers default and custom configuration files. When running Grafana in a Docker container, you can personalize the Grafana instance by adding environment variables to the docker run command. These variables will override the default Grafana settings.
Grafana offers a wide range of customization options. Custom variables can also be created according to a particular use case. The format for Grafana variables takes into consideration the section and the variable name:
GF_<SectionName>_<KeyName>

#Example

GF_DEFAULT_INSTANCE_NAME
Here, the name of the Grafana server instance can be set for easy delineation, and authorization details can be set so the user can immediately log into the Grafana user interface with one command:
docker run -d --name=sample_grafana -v grafana-storage:/var/lib/grafana \
-p 3000:3000  -e GF_DEFAULT_INSTANCE_NAME=my-grafana \
-e GF_SECURITY_ADMIN_USER=demo -e \
GF_SECURITY_ADMIN_PASSWORD__FILE=/run/secrets/password grafana/grafana
Setting custom configurations with environment variables can be a drawn-out process, with each variable needing to be declared. In cases where this gets too bulky or a simpler command is needed, you can create a custom configuration file with the required variable values. You can then exchange this file for the default configuration file that gets used in the docker run commands via bind mounts.
The following command takes a grafana.ini file created locally and binds it to the default configuration file created as the Grafana container is started:
docker run -d --name=sample_grafana -v ./grafana.ini:etc/grafana.ini \
-v grafana-storage:/var/lib/grafana -p 3000:3000 grafana/grafana
Managing Grafana Plugins
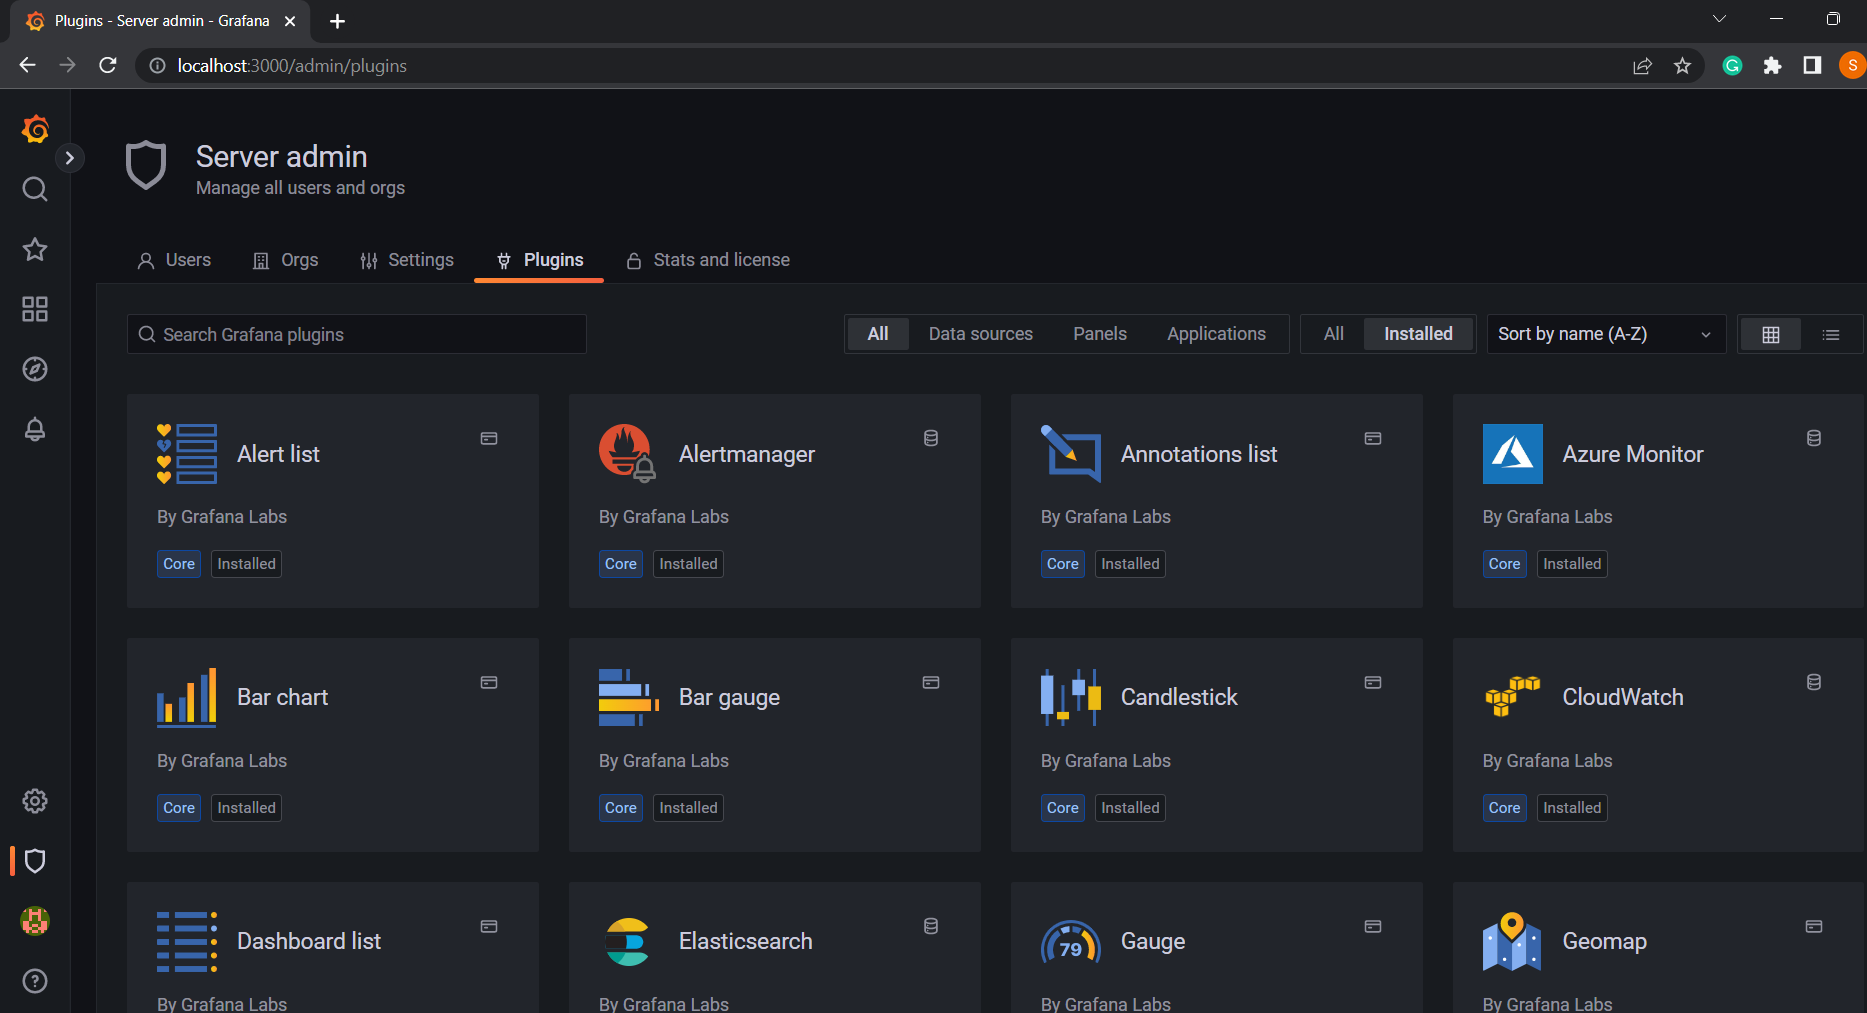
By default, a number of plugins are installed in the Grafana container, including Prometheus and some database and visualization options. You can install more from the official Grafana Plugins page; this gives a wide range of integrations with popular and useful software:

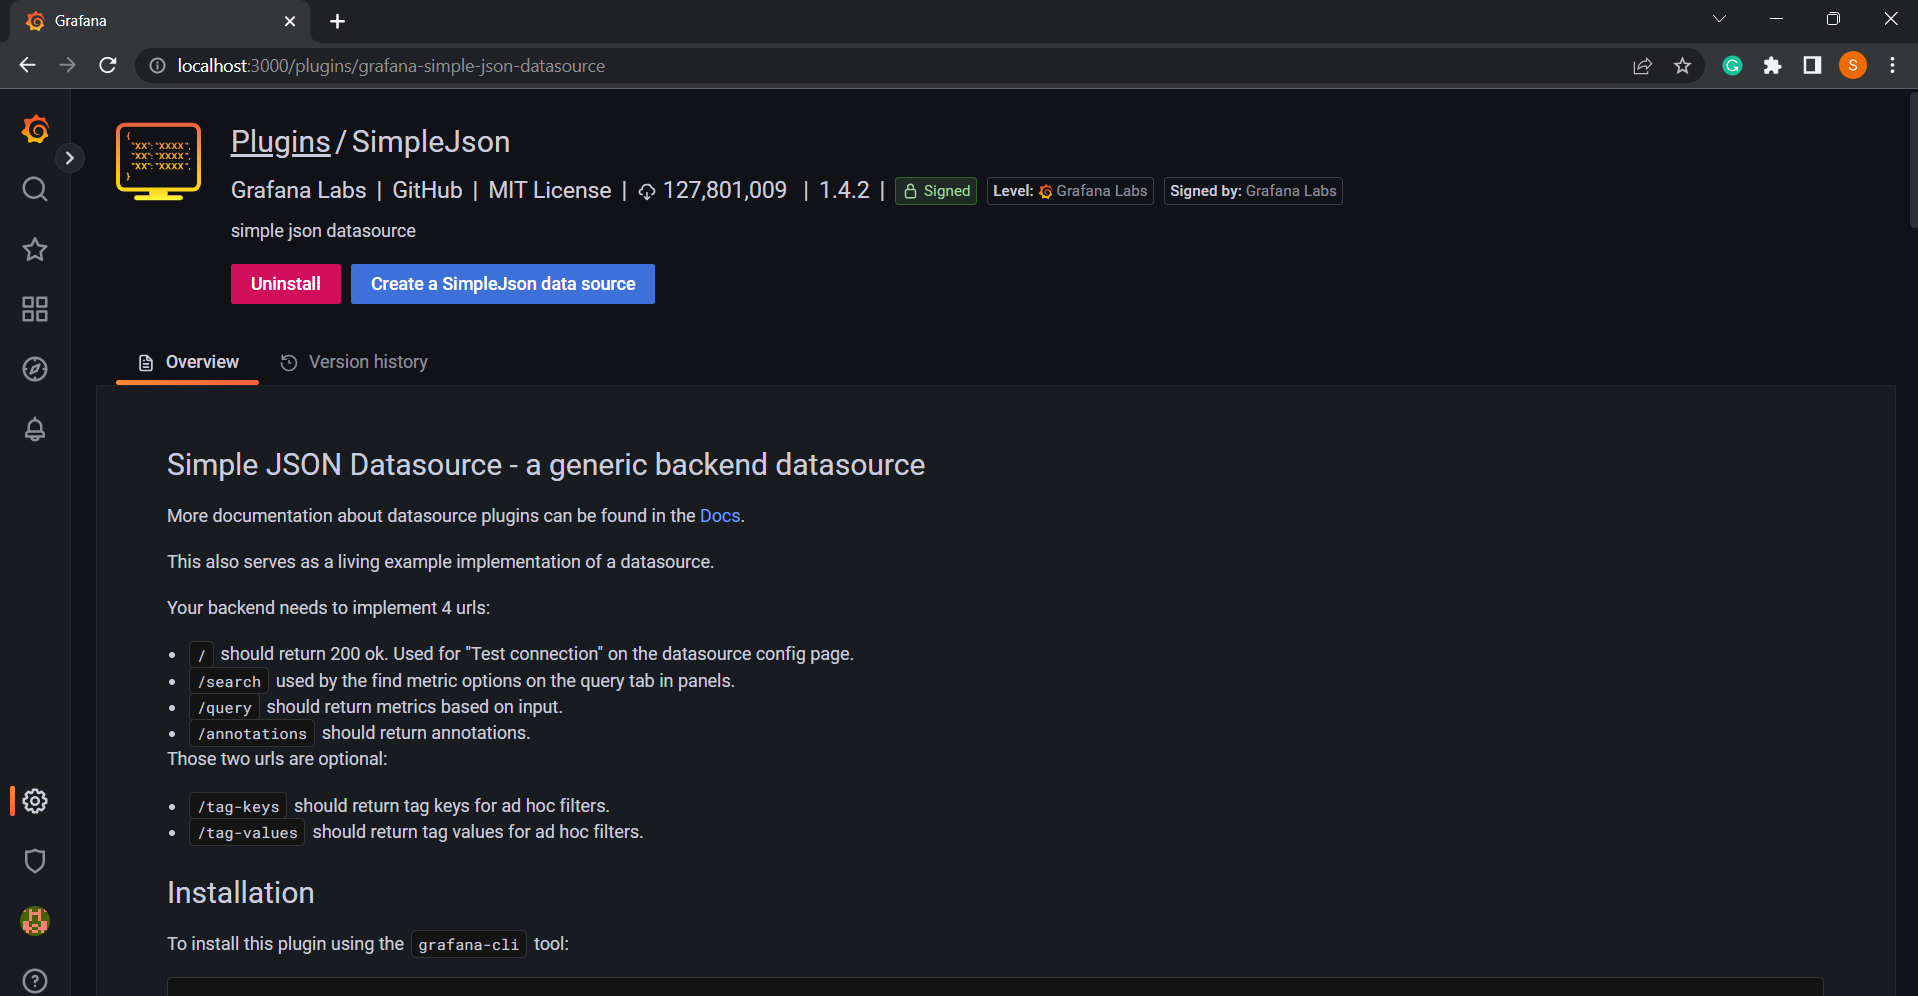
More official plugins can also be added to the Grafana container by utilizing the plugin environmental variable (GF_INSTALL_PLUGINS), which accepts comma-separated strings of the plugin’s name tag.
For example, run the following command to add a Datasource plugin for JSON files:
docker run -d --name=sample_grafana -e \
GF_INSTALL_PLUGINS=grafana-simple-json-datasource -v \
grafana-storage:/var/lib/grafana -p 3000:3000 grafana/grafana
Note: Plugins from other sources outside of the official Grafana repository and its community can also be installed. To do this, substitute the plugin name tag with a URL for the unofficial plugin.
Creating a Custom Grafana Docker Image
To help create a repeatable template with preferred plugins and customized settings and to ease the workflow, a custom Grafana Docker image can be built from scratch.
To do so, use the official Grafana Docker image as a base layer and declare the customizations through bind mounts and environmental variables in a Dockerfile; then build and store that image:
FROM grafana/grafana:latest

ENV GF_INSTALL_PLUGINS=grafana-simple-json-datasource

COPY grafana.ini /etc/grafana/grafana.ini
Another way to build a customized image is through the official Grafana GitHub, where a custom Dockerfile is stored with build arguments for plugins and the preferred Grafana version to be used:
cd packaging/docker/custom

docker build \
  --build-arg "GRAFANA_VERSION=latest" \
  --build-arg "GF_INSTALL_PLUGINS=grafana-clock-panel,\
  grafana-simple-json-datasource" \
  -t grafana-custom -f Dockerfile .

docker run -d -p 3000:3000 --name=grafana grafana-custom
Conclusion
So, we’ve learned that Grafana is a cool open-source tool for analyzing and monitoring data, making debugging and optimization simpler. We’ve dug into how to use it with Docker containers. And if you’re liking Docker for Grafana, you might love Earthly for even smoother build processes. It’s definitely worth checking out!
Hope this all sinks in!
Earthly makes CI/CD super simple
Fast, repeatable CI/CD with an instantly familiar syntax – like Dockerfile and Makefile had a baby.


