Monitoring System Metrics With Grafana and Prometheus
We’re Earthly. We make building software simpler and therefore faster using containerization. This article is about monitoring system metrics but if you’re interested in a different approach to building and packaging software then check us out.
In today’s fast-paced world, monitoring system metrics has become essential for businesses and organizations to ensure their systems are performing at their best. As system complexity grows, it becomes increasingly important to keep track of metrics that can help identify bottlenecks, errors, and other performance issues.
Monitoring system metrics provides insights into how a system is performing and can help identify issues that may impact system availability, user experience, and overall system health. By monitoring metrics such as CPU usage, memory usage, disk utilization, network traffic, and other critical parameters, you can proactively identify and resolve issues before they become significant problems.
In this article, you’ll learn how to set up a monitoring stack consisting of Grafana, Prometheus, Alertmanager, and Node-exporter using Docker-compose. By the end of this tutorial, you will have a fully functional monitoring system that can help you keep track of your system’s performance and identify any issues that may arise.
Let’s get started!
Overview
In this section, you’re going to get a quick introduction to the vital components of your monitoring solution: Prometheus, Grafana, Alertmanager, and Node-exporter. These open-source tools each have a unique role in helping you build a robust and scalable system to monitor your system metrics.
What Is Prometheus?
Prometheus is an open-source monitoring and alerting toolkit designed for reliability and scalability. It was developed primarily to monitor containerized applications and microservices but can be used to monitor any system. Prometheus works by periodically scraping metric data from specified targets, such as web applications or databases, and stores this data in a time-series database. It supports querying this data using its powerful query language called PromQL, which enables users to perform complex analyses of the collected metrics.
What Is Grafana?
Grafana is an open-source platform for data visualization and monitoring. By connecting to various data sources, including Prometheus, users can create, explore, and share visually appealing dashboards. Grafana is an excellent tool for monitoring system metrics, application performance, and infrastructure health.
What Is Alertmanager?
Alertmanager is a component of the Prometheus ecosystem responsible for handling alerts generated by Prometheus. It takes care of deduplicating, grouping, and routing alerts to the appropriate receiver (e.g., email, Slack, PagerDuty) based on configurable routing rules. Alertmanager also supports silencing and inhibiting alerts, allowing for more sophisticated alert management.
What Is Node-Exporter?
Node-exporter is an exporter for Prometheus, designed to collect hardware and operating system metrics from a host. It runs on each node (server, virtual machine, or container) you want to monitor and exposes system-level information such as CPU, memory, disk usage, and network statistics. Prometheus scrapes these metrics from Node-exporter and stores them in its time-series database
In summary, the combination of Prometheus, Grafana, Alertmanager, and node-exporter creates a comprehensive monitoring solution. Node-exporter gathers system metrics from each host and makes them available for Prometheus to scrape. Prometheus then processes this data and stores it in its time-series database. Grafana connects to Prometheus as a data source, allowing users to create visually appealing dashboards that analyze the collected metrics. When user-defined alert rules are met, Prometheus sends these alerts to Alertmanager. Alertmanager handles the alerts, managing deduplication, grouping, and routing them to the appropriate receivers. By using Docker-compose, you can easily deploy and manage this robust and scalable monitoring solution for your infrastructure and applications.
Prerequisites
To follow along with this step-by-step tutorial, you should have the following:
Two or more instances running a Linux distribution, usually Debian or Red Hat. This guide will utilize two virtual machines (t3.micro) running Ubuntu on AWS. Full network connectivity between machines (machines can either be in a public or private network). Slack channel and webhook URL for the channel Docker Docker-Compose
You can find all the code used in the tutorial in this GitHub repository.

Setting Up Node Exporter
As a first step, you need to install the node-exporter binary in the instance you want to monitor (node one). To do this ssh in the monitored node(Node-1) and run the following commands:
## Download  the Node Exporter Binary
wget https://github.com/prometheus/node_exporter/releases/download/v1.3.1/node_exporter-1.3.1.linux-amd64.tar.gz

## List the context of the current directory to confirm the downloaded binary
ls

## Extract Node Exporter binary
tar xvf node_exporter-1.3.1.linux-amd64.tar.gz
After extracting the node exporter binary the next step is for you is to move the binary file node_exporter to the /usr/local/bin directory of your system.
## Change the directory into the node exporter folder

cd node_exporter-1.3.1.linux-amd64

## Copy the node-exporter binary to the /usr/local/bin of your system

sudo cp node_exporter /usr/local/bin
After copying the node exporter binary to the /usr/local/bin of your machine, As a good practice, you will create a user in the system for Node Exporter run as instead of running as root.
sudo useradd --no-create-home --shell /bin/false node-exporter

##  set the owner of the binary node_exporter to the recently created user

sudo chown node-exporter:node-exporter /usr/local/bin/node_exporter
After creating the node-exporter user the next step is to create and start the node-exporter service. First, you will create a node-exporter config and paste the following configuration into it:
sudo nano /etc/systemd/system/node_exporter.serviceNext, paste the following content in the file:
## node_exporter.service

[Unit]
Description=Node Exporter
Wants=network-online.target
After=network-online.target

[Service]
User=node-exporter
Group=node-exporter
Type=simple
ExecStart=/usr/local/bin/node_exporter

[Install]
WantedBy=multi-user.target
You define the service’s general information, parameters, and dependencies in the node-exporter configuration file. The [Unit] part ensures that the service starts once the network is up and running, whereas the [Service] portion defines the user, group, and executable that will run the service. Finally, the [Install] part specifies the service’s target, allowing it to boot with the system. Overall, this configuration is critical for managing and specifying the node-exporter service’s behavior within the system.
As a next step, close nano and save the changes to the file. Proceed to reload the daemon:
sudo systemctl daemon-reload

## Finally start the node-exporter service

sudo systemctl start node_exporter
At this point, your node exporter should be up and running but you can confirm that your node exporter service is by running the following:
sudo systemctl status node_exporter
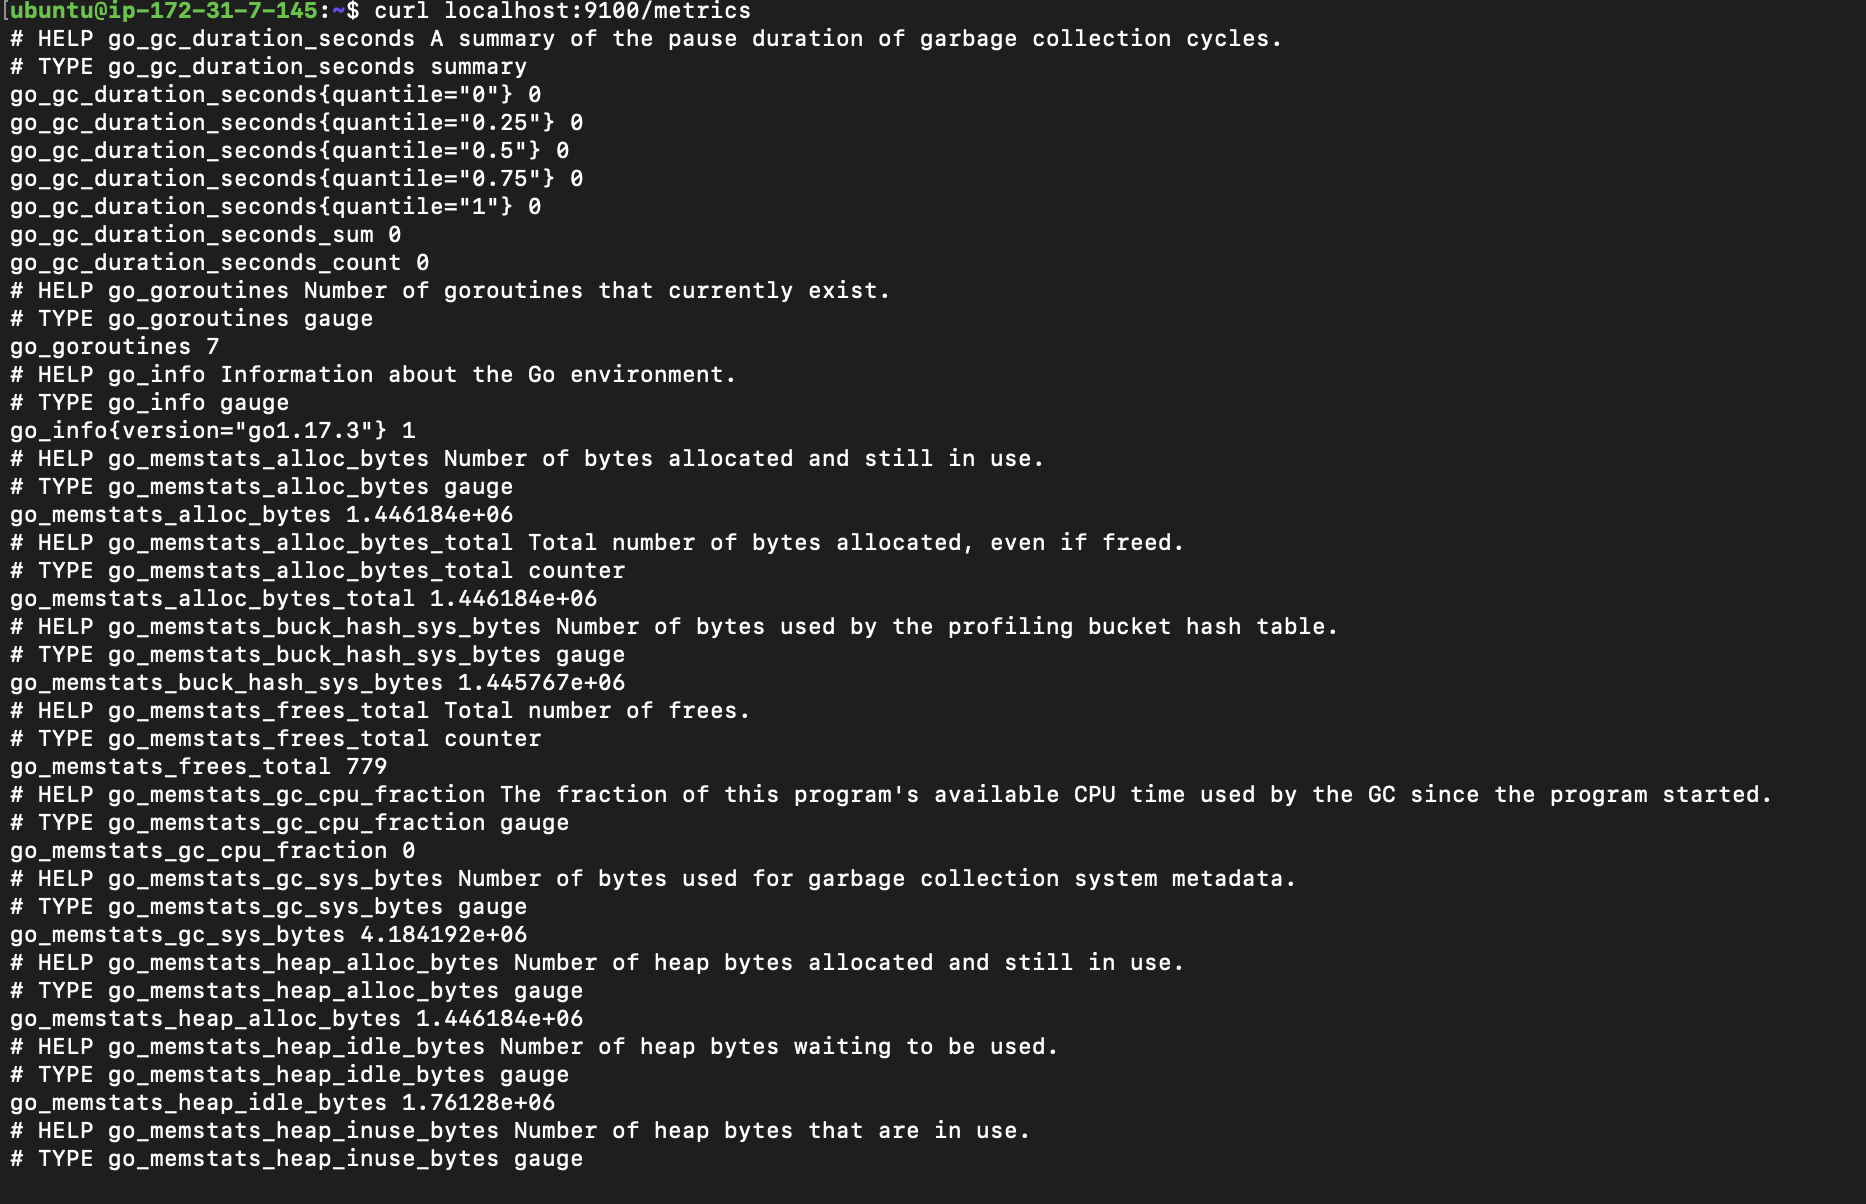
Your node-exporter is now up and running but you can further test the node-exporter service by navigating to the following endpoint http://your_server_ip:9100/metrics on your browser or curl localhost:9100/metrics at the command line.
Setting Up Alerting Rule and Prometheus Custom Configuration
After successfully installing a node-exporter on the node that requires monitoring, the next step is to set up Prometheus, Grafana, and Alert Manager. Firstly, you need to establish an alert.rules file that will hold a pre-defined collection of alerts designed to activate when specific conditions are met. You can create this file by executing the following set of commands:
## Create a directory called monitoring and change the directory into it

mkdir monitoring && cd monitoring

## create a file called alert.rules and paste the following into it
nano alert.rules
Next, Paste the configuration below:
## alert.rules

groups:
- name: targets
  rules:
  - alert: monitored_service_down
    expr: up == 0
    for: 30s
    labels:
      severity: critical
    annotations:
      summary: "Critical: Monitored service {{ $labels.instance }}
      is non-responsive"
      description: "The {{ $labels.instance }} service has failed
      and is currently not responsive. Immediate attention is required to
      restore service functionality."

- name: hosts
  rules:
  - alert: high_cpu_utilization
    expr: node_load1 > 1.5
    for: 30s
    labels:
      severity: warning
    annotations:
      summary: "High CPU utilization detected on {{ $labels.instance }}:
      {{ $value }}"
      description: "The {{ $labels.instance }} has
      experienced a high level of CPU utilization, with a load average
      of {{ $value }} for the last 30 seconds. This may indicate an
      issue with the performance of the host, and requires investigation."

  - alert: low_memory_availability
    expr: (sum(node_memory_MemTotal_bytes) -
    sum(node_memory_MemFree_bytes +
    node_memory_Buffers_bytes + node_memory_Cached_bytes) ) /
    sum(node_memory_MemTotal_bytes) * 100 > 75
    for: 30s
    labels:
      severity: warning
    annotations:
      summary: "Low memory availability detected on {{ $labels.instance }}:
      {{ $value }}%"
      description: "The {{ $labels.instance }} has experienced a
      low level of available memory, with utilization at {{ $value }}%
      for the last 30 seconds. This may indicate an issue with the
      memory management on the host, and requires investigation."

  - alert: high_disk_space_utilization
    expr: (node_filesystem_size_bytes{mountpoint="/"} -
    node_filesystem_free_bytes{mountpoint="/"}) /
    node_filesystem_size_bytes{mountpoint="/"} * 100 > 75
    for: 30s
    labels:
      severity: warning
    annotations:
      summary: "High disk space utilization detected on
      {{ $labels.instance }}: {{ $value }}%"
      description: "The {{ $labels.instance }} has
      experienced a high level of disk space utilization, with
      utilization at {{ $value }}% for the
      last 30 seconds. This may indicate an issue with the storage
      management on the host, and requires investigation."

  - alert: high_ram_utilization
    expr: 100 * (1 - ((node_memory_MemFree_bytes +
    node_memory_Buffers_bytes + node_memory_Cached_bytes) /
    node_memory_MemTotal_bytes)) > 75
    labels:
      severity: warning
    annotations:
      summary: "High RAM utilization detected on
      {{ $labels.instance }}: {{ $value }}%"
      description: "The {{ $labels.instance }} has
      experienced a high level of RAM utilization, with utilization at
      {{ $value }}% for the last 30 seconds.
      This may indicate an issue on the host, and requires investigation."

  - alert: RebootRequired
    expr: 'node_reboot_required > 0'
    labels:
      severity: warning
    annotations:
      description: '{{ $labels.instance }} requires a reboot.'
      summary: 'Instance {{ $labels.instance }} - reboot required'
The alert configuration you provided includes two primary types of rules: targets and hosts. The target group is responsible for defining rules to monitor the status of a particular service on a target. If the service becomes unavailable for a duration exceeding 30 seconds, an alert of critical severity will be generated. Meanwhile, the hosts group includes rules that oversee the CPU, memory, disk space, and RAM usage of a host, with a threshold set at 75%. Should any of these usage levels surpass the set threshold, a warning message is triggered, prompting the need for further analysis to avert potential issues.
Following the definition of alerting rules, the Prometheus configuration must be created. To do so run the following commands in the current directory
## Create a file called prometheus.yml

nano prometheus.yml
Next, paste the following config into the yaml you just created
## prometheus.yml

rule_files:
  - "alert.rules"

global:
  scrape_interval: "30s"
  evaluation_interval: 5s
  external_labels:
    env: Development

scrape_configs:
  - job_name: "prometheus"
    scrape_interval: 30s
    static_configs:
      - targets: ["localhost:9090"]
  - job_name: "node"
    static_configs:
      - targets: ["54.193.79.34:9100"]

alerting:
  alertmanagers:
    - scheme: http
      static_configs:
        - targets:
            - 'alertmanager:9093'
Starting with the rule_files section, the alert.rules file is explicitly designated to contain alerting rules that stipulate the circumstances under which alerts should be activated. These rules were previously created as part of the configuration process.
In the global section, the scrape_interval directive determines the frequency at which Prometheus should collect metrics from its targets, while the evaluation_interval directive specifies the frequency at which Prometheus should evaluate the alerting rules. Additionally, the external_labels section defines labels that can be applied to the targets and their corresponding metrics for better organization.
The scrape_configs section defines two jobs, namely prometheus and node. The prometheus job is used to scrape metrics from the Prometheus server itself, while the node job is responsible for scraping metrics from a specific target with an IP address of 54.193.79.34 and port 9100. The labels section identifies the instance label with a value of node-1, helping to identify this particular target.
Lastly, the alerting section includes the alert managers directive, which identifies the alert manager endpoint(s) responsible for sending alerts. In this case, a single alert manager is defined with the URLhttp://alertmanager:9093.
Creating Alert-Manager Custom Configuration
Having configured the alerting rule and custom Prometheus settings, the next step is to define the Alertmanager configuration. Nonetheless, before proceeding with the configuration, it is crucial to create a Slack channel and obtain the Slack webhook URL. To do so, refer to the official Slack documentation and follow the instructions provided.
After obtaining the Slack webhook URL, create the alert-manager YAML file and add the following configuration:
## create the alert-manager.yml
nano alert-manager.yml
Next, add the following configuration:
## alert-manager.yml

global:
  slack_api_url: "https://hooks.slack.com/services/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"

route:
  group_by: ['instance', 'severity']
  group_wait: 30s
  group_interval: 5m
  repeat_interval: 3h
  receiver: 'default-notifications' # Add default receiver here
  routes:

- match:
      severity: warning
    receiver: 'warning-notifications'
- match:
      severity: critical
    receiver: 'critical-notifications'

receivers:

- name: 'default-notifications' # Define default receiver here
  slack_configs:
  - channel: "#mointoring-tutorial"
    text: "summary: {{ .CommonAnnotations.summary }}:
    {{ .CommonAnnotations.description }}"

- name: 'warning-notifications'
  slack_configs:
  - channel: "#mointoring-tutorial"
    text: "Warning alert: {{ .CommonAnnotations.summary }}:
    {{ .CommonAnnotations.description }}"

- name: 'critical-notifications'
  slack_configs:
  - channel: "#mointoring-tutorial"
    text: "Critical alert: {{ .CommonAnnotations.summary }}:
    {{ .CommonAnnotations.description }}"
📑Replace the slack_api_url and channel values with your own.
The YAML configuration file is designed to establish receivers and routes for forwarding alerts to a designated Slack channel through Alertmanager, an integral component of the Prometheus monitoring system.
In the global section, the Slack webhook URL is defined to facilitate communication with the Slack channel. The route section, on the other hand, outlines how alerts are to be grouped and sent to specific receivers depending on their severity level.
The receivers section defines two separate receivers, namely warning-notifications and critical-notifications, which are responsible for dispatching alerts to the #monitoring-tutorial channel on Slack. The message content is created using Go template syntax to include the summary and description of the alert.
Overall, this configuration file allows Alertmanager to interface with Slack and send alerts based on specific criteria, streamlining the monitoring process and ensuring prompt responses to critical issues.
Setting Up Grafana Custom Configuration
At this point, you have already set up your alerting rules, Prometheus, and alert manager custom configuration. As a next step, create a grafana custom configuration to make your prometheus the data source for grafana. Grafana will be used to visualize the be scraped and aggregated by Prometheus.
As a first step, you will create a file called datasource.yml
## create a file called datasource.yml

nano datasource.yml
And paste the following configuration into it:
## datasource.yml

# config file version

apiVersion: 1

# list of datasources that should be deleted from the database

deleteDatasources:

- name: Prometheus
    orgId: 1

# list of datasources to insert/update depending

# whats available in the database

datasources:

# name of the datasource. Required

- name: Prometheus

# datasource type. Required

    type: prometheus

# access mode. direct or proxy. Required

    access: proxy

# org id. will default to orgId 1 if not specified

    orgId: 1

# url

    url: <http://prometheus:9090>

# database password, if used

    password:

# database user, if used

    user:

# database name, if used

    database:

# enable/disable basic auth

    basicAuth: false

# basic auth username, if used

    basicAuthUser:

# basic auth password, if used

    basicAuthPassword:

# enable/disable with credentials headers

    withCredentials:

# mark as default datasource. Max one per org

    isDefault: true

# fields that will be converted to json and stored in json_data

    jsonData:
      graphiteVersion: "1.1"
      tlsAuth: false
      tlsAuthWithCACert: false

# json object of data that will be encrypted

    secureJsonData:
      tlsCACert: "..."
      tlsClientCert: "..."
      tlsClientKey: "..."
    version: 1

# allow users to edit datasources from the UI

    editable: true
This is a configuration file that specifies how to manage data sources in a database. It includes instructions to delete a data source named “Prometheus” from the database, as well as instructions to insert or update a data source also named “Prometheus” in the database.
The data source is defined with various attributes such as its type, access mode, URL, authentication credentials, and more. The configuration file also specifies that this data source should be marked as the default for the organization and that it should be editable from the user interface.
Overall, this configuration file provides a way to manage and configure data sources in a database to ensure that they are set up correctly and consistently across an organization.
Configuring and Starting Docker Compose
You now have all the custom configurations of your monitoring stacks (Alerting Rules, Prometheus, Grafana), next define the docker-compose configuration for all the stacks and start all the services.
## Create a file and name is docker-compose.yml

nano docker-compose.yml
Next, paste the following configuration:
## docker-compose.yml

version: '3.1'

volumes:
    prometheus_data: {}
    grafana_data: {}

services:

  prometheus:
    image: prom/prometheus:v2.17.1
    container_name: prometheus
    volumes:
      - ./prometheus.yml:/etc/prometheus/prometheus.yml
      - ./alert.rules:/etc/prometheus/alert.rules
      - prometheus_data:/prometheus
    command:
      - '--config.file=/etc/prometheus/prometheus.yml'
      - '--storage.tsdb.path=/prometheus'
      - '--web.console.libraries=/etc/prometheus/console_libraries'
      - '--web.console.templates=/etc/prometheus/consoles'
      - '--storage.tsdb.retention.time=200h'
      - '--web.enable-lifecycle'
    restart: unless-stopped
    ports:
      - 9090:9090

  alertmanager:
    image: prom/alertmanager:v0.20.0
    container_name: alertmanager
    volumes:
      - ./alert-manager.yml:/etc/alertmanager/config.yml
    command:
      - '--config.file=/etc/alertmanager/config.yml'
      - '--storage.path=/alertmanager'
    restart: unless-stopped
    ports:
      - 9093:9093

  grafana:
    image: grafana/grafana:latest
    container_name: grafana
    volumes:
      - grafana_data:/var/lib/grafana
      - ./datasource.yml:/etc/grafana/provisioning/datasources/datasource.yml
    environment:
      - GF_SECURITY_ADMIN_USER=admin
      - GF_SECURITY_ADMIN_PASSWORD=admin
      - GF_USERS_ALLOW_SIGN_UP=false
    restart: unless-stopped
    ports:
      - 3000:3000
Your monitoring stacks are now ready to be started after the Docker compose file has been created. In your monitoring folder, run the following command to see if it has the same structure as below:

After confirming the folder set-up the next is to start all the services with docker-compose. To do so run the following command:
docker-compose up -dTo confirm that all your containers are running the following command
docker-compose ps
Accessing the Prometheus and Grafana Web UI
At this point all your monitoring services are all and running, the next step is to access the Prometheus and Grafana web UI. To access the Prometheus UI, on your favorite browser navigate to http://your_monitor_server_ip:9090/targets
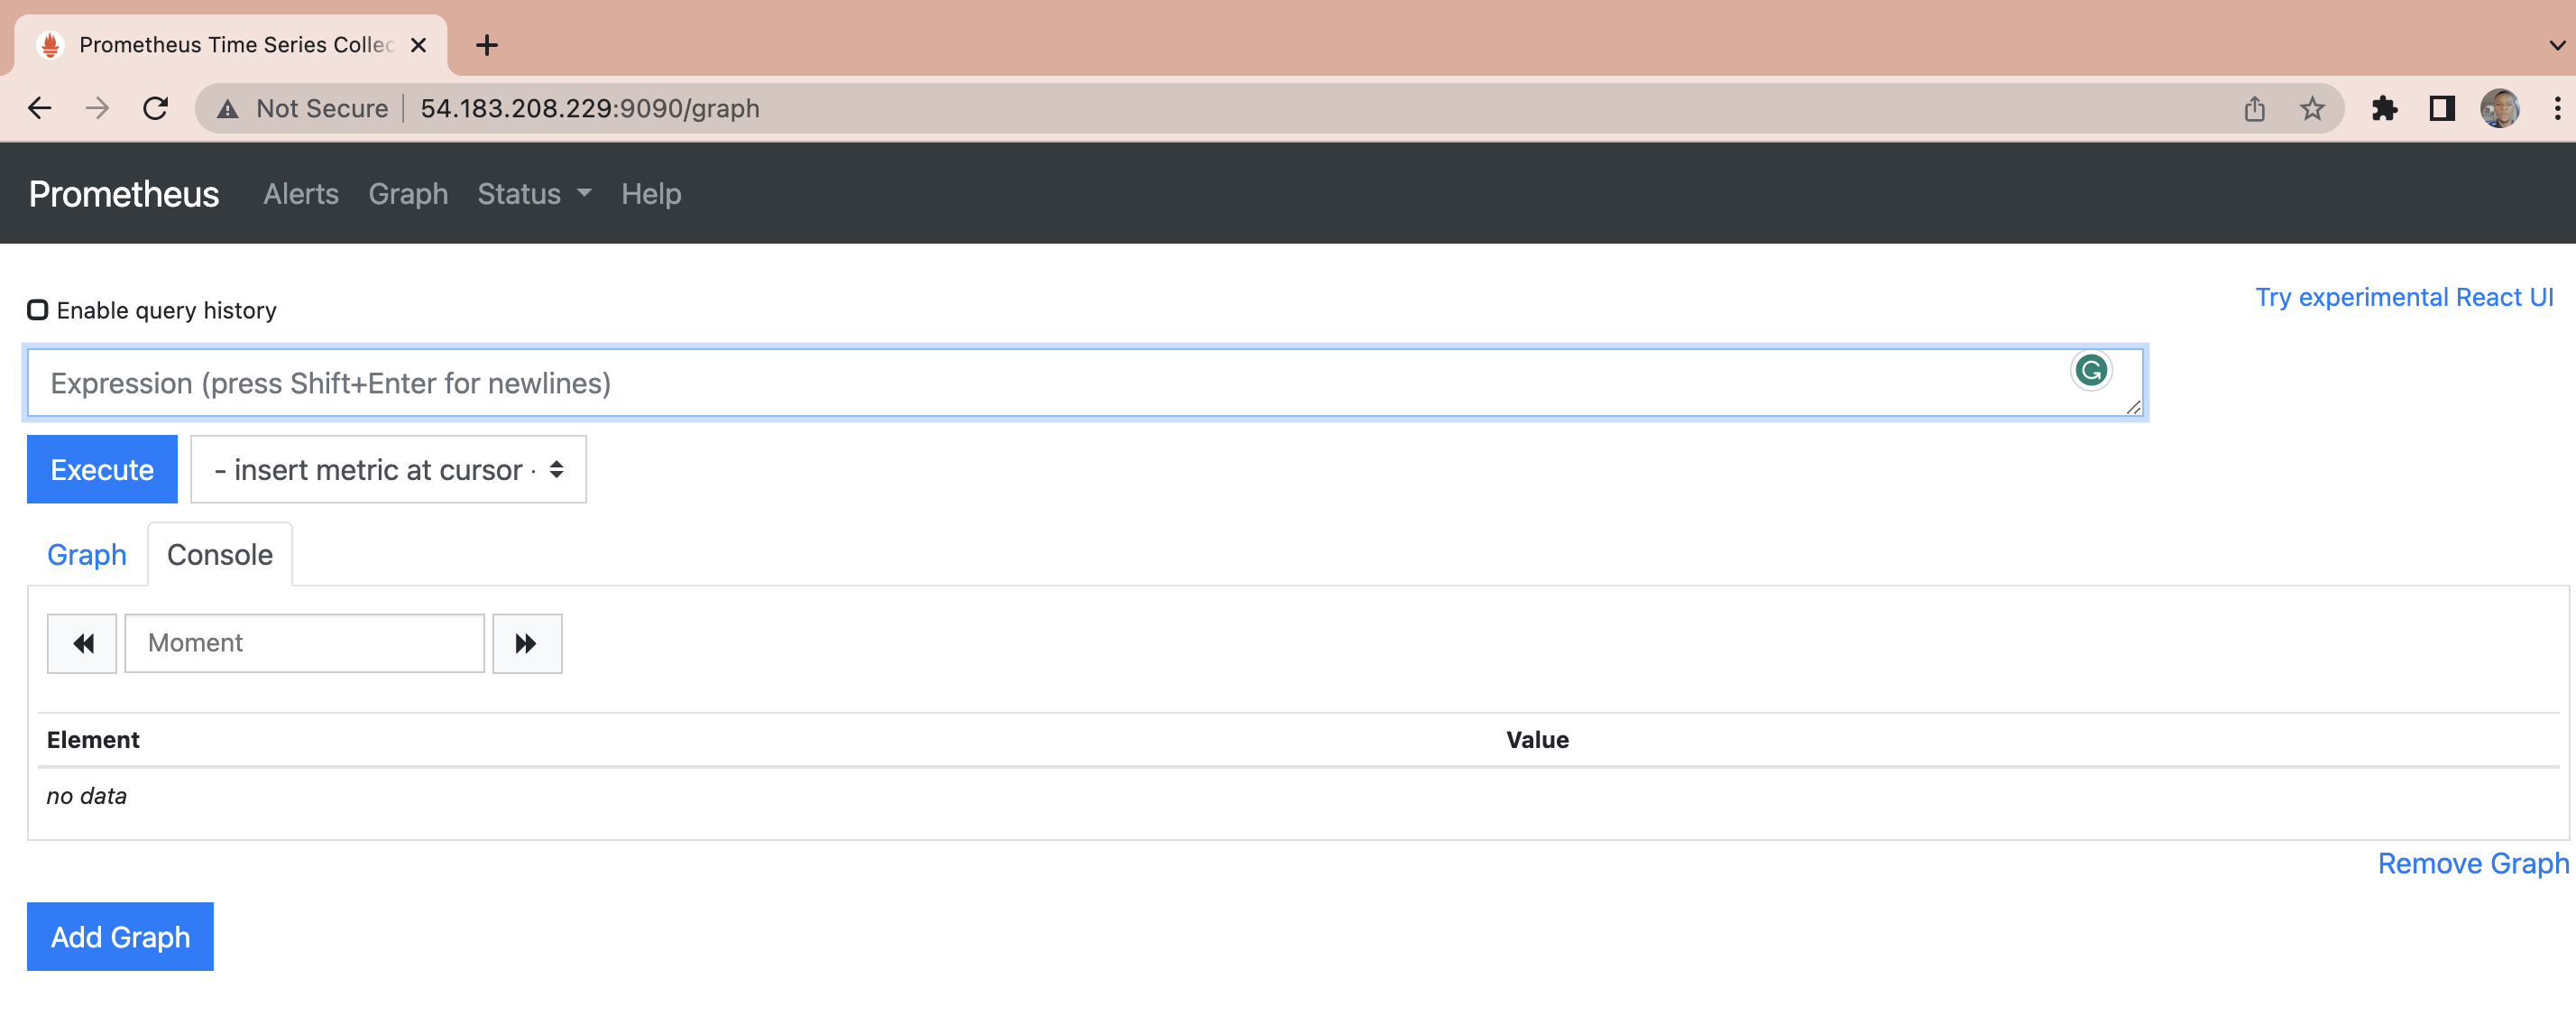
While you can further explore Prometheus UI and run queries using PromQL, this guide is more focused on Grafana UI and visualization because Prometheus has v limited visualization capabilities.
To access the Grafana dashboard navigate to http://your_monitor_server_ip:3000 on your browser
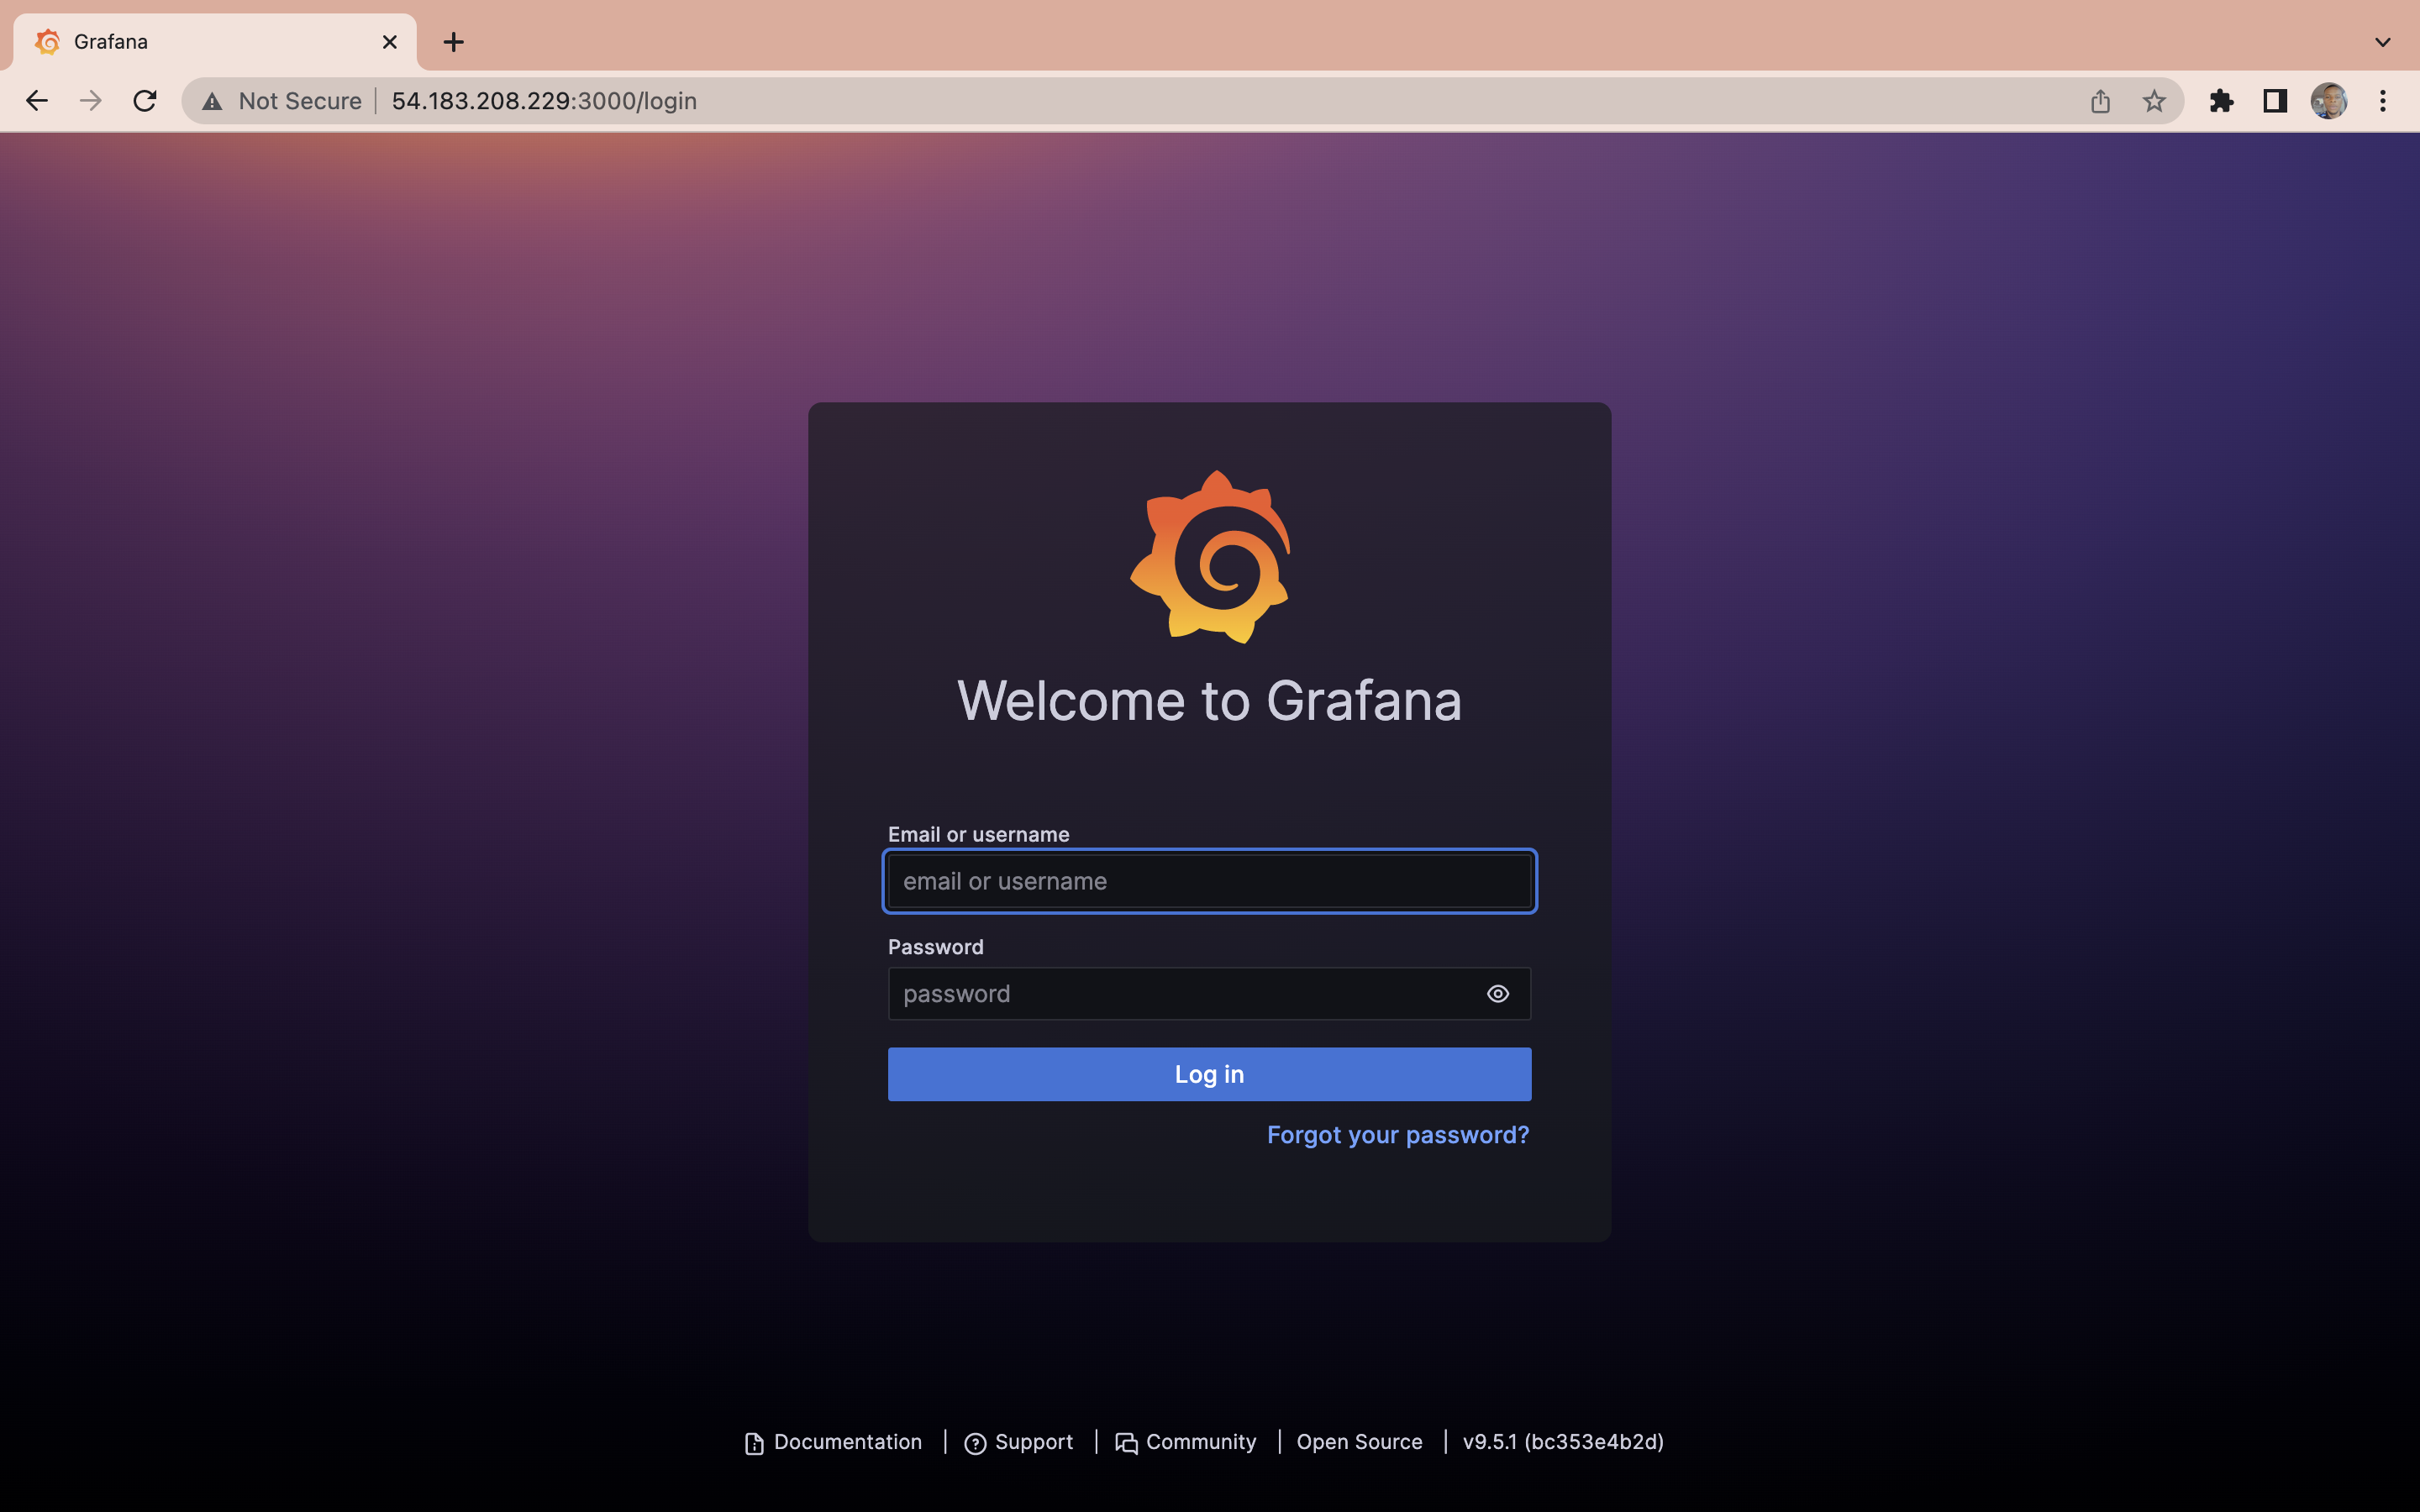
Next, use the username admin and the password admin:
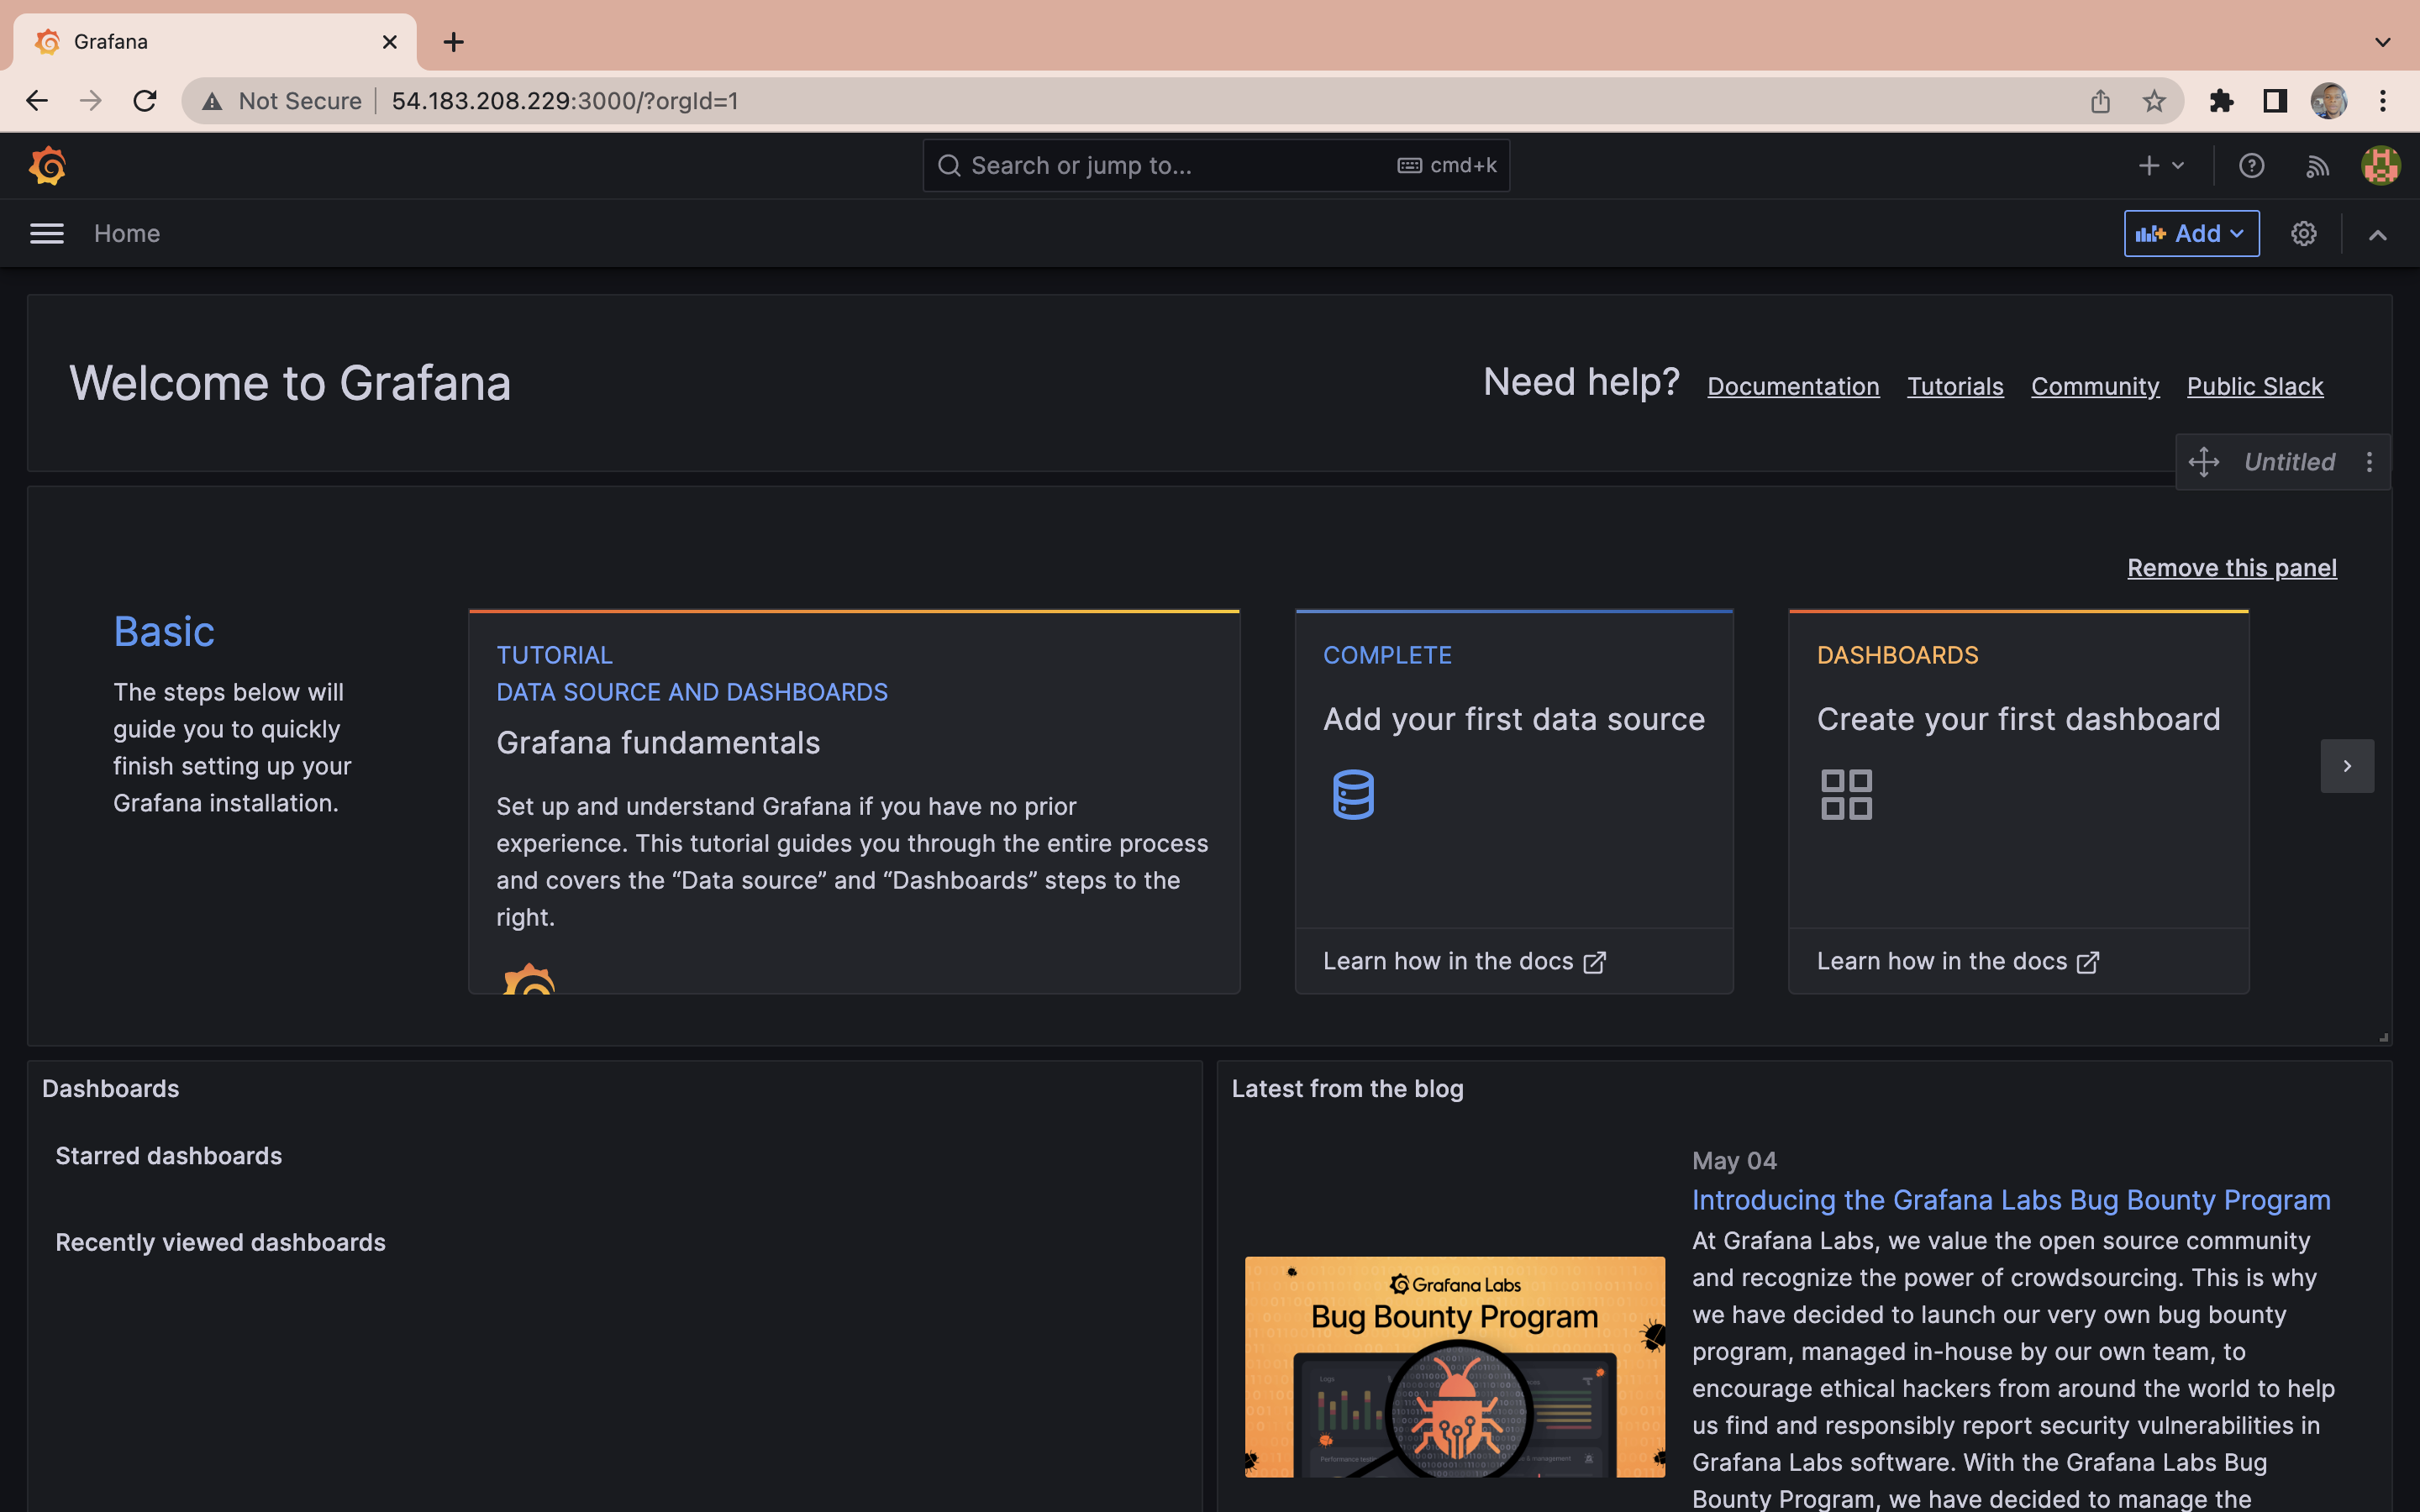
Once you have logged into Grafana UI, you can start visualizing Prometheus metrics. To do so navigate to http://your_monitor_server_ip:3000/dashboards:
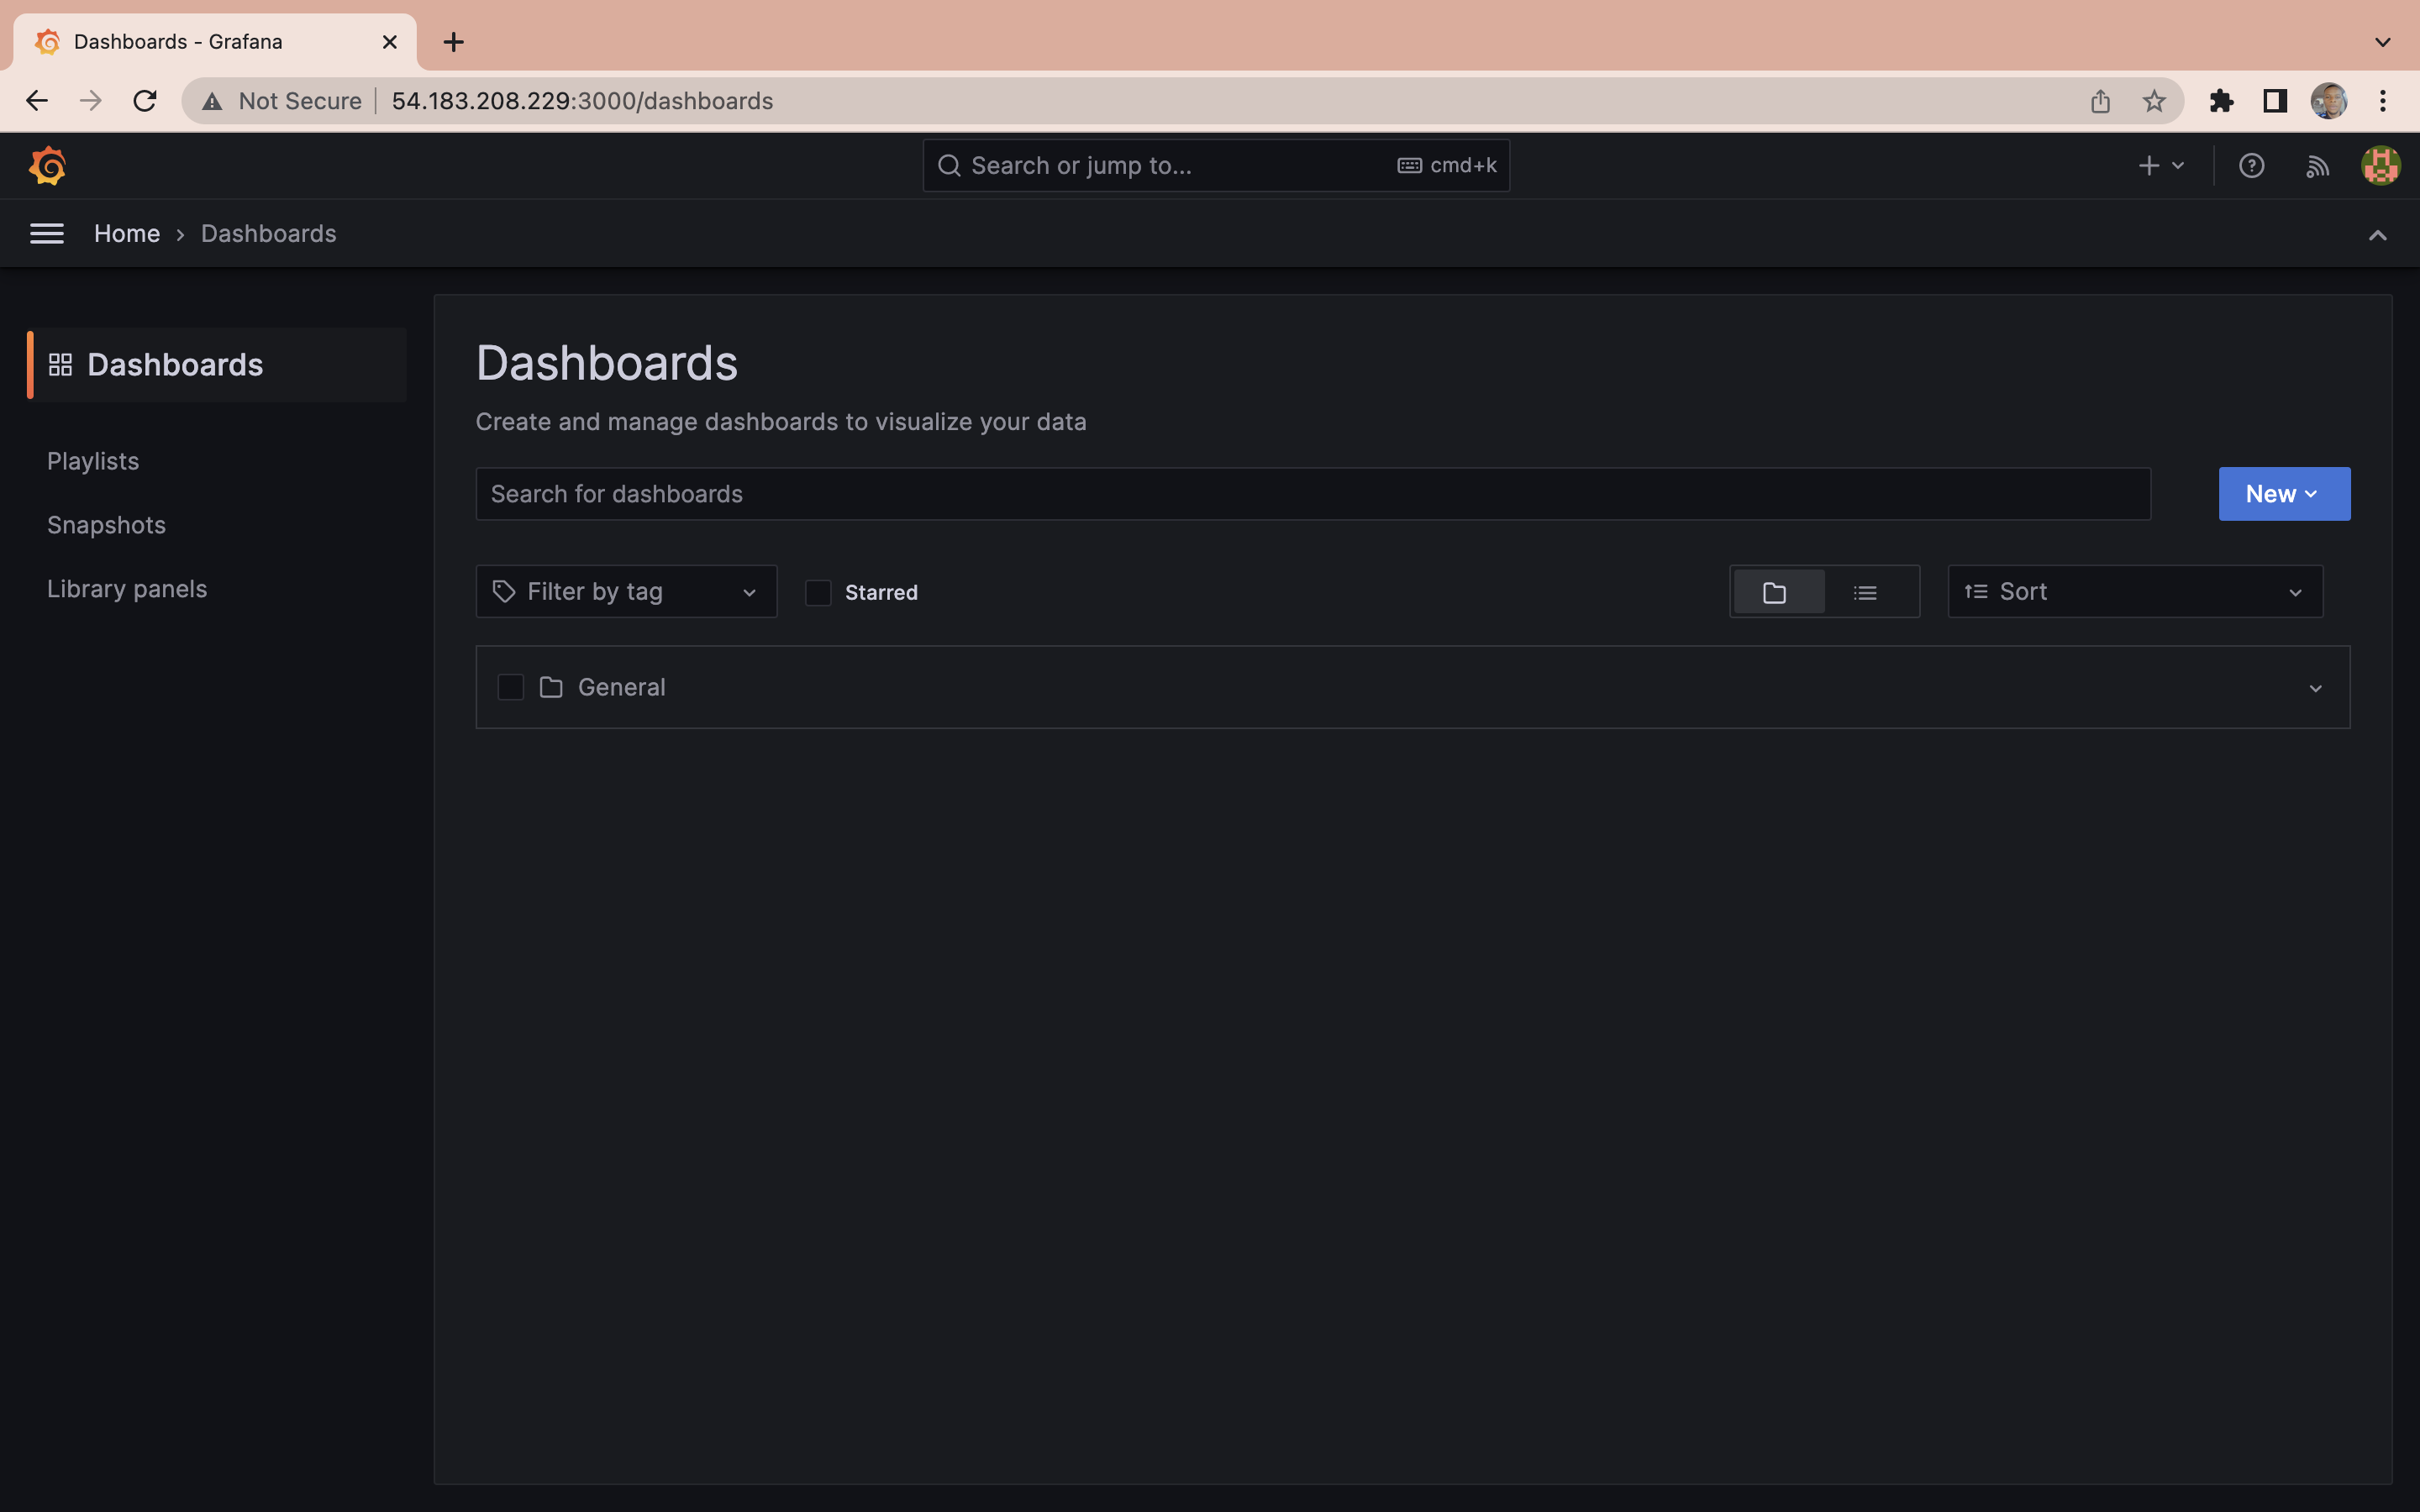
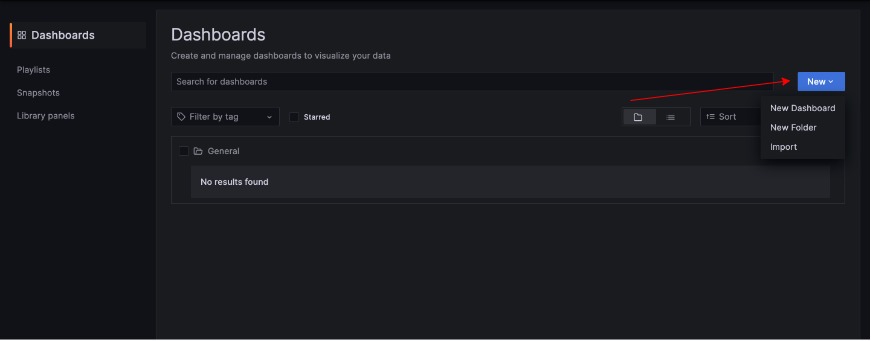
Next, click on the Next button and then from the drop-down import:
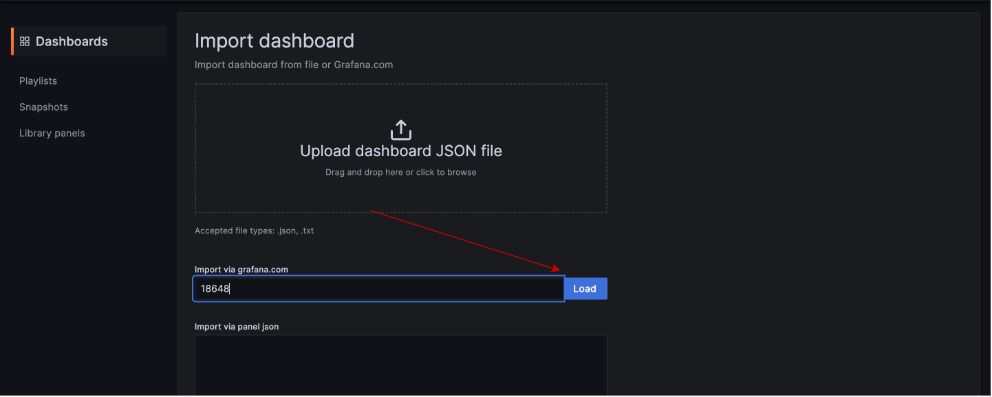
Paste 12486 in the Import via grafana.com box then click on load:
Then click on import:
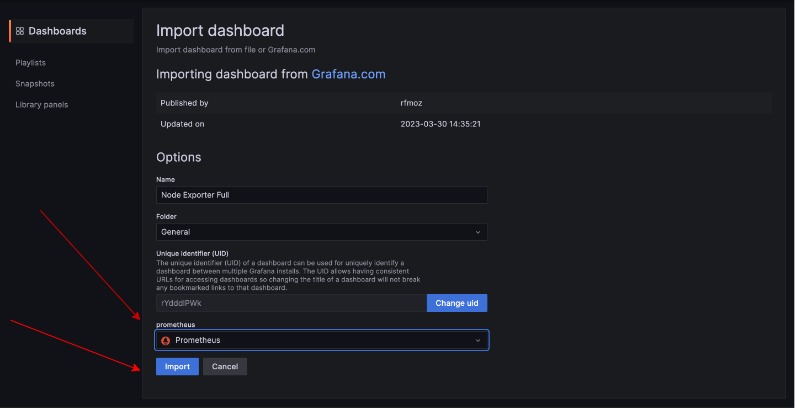
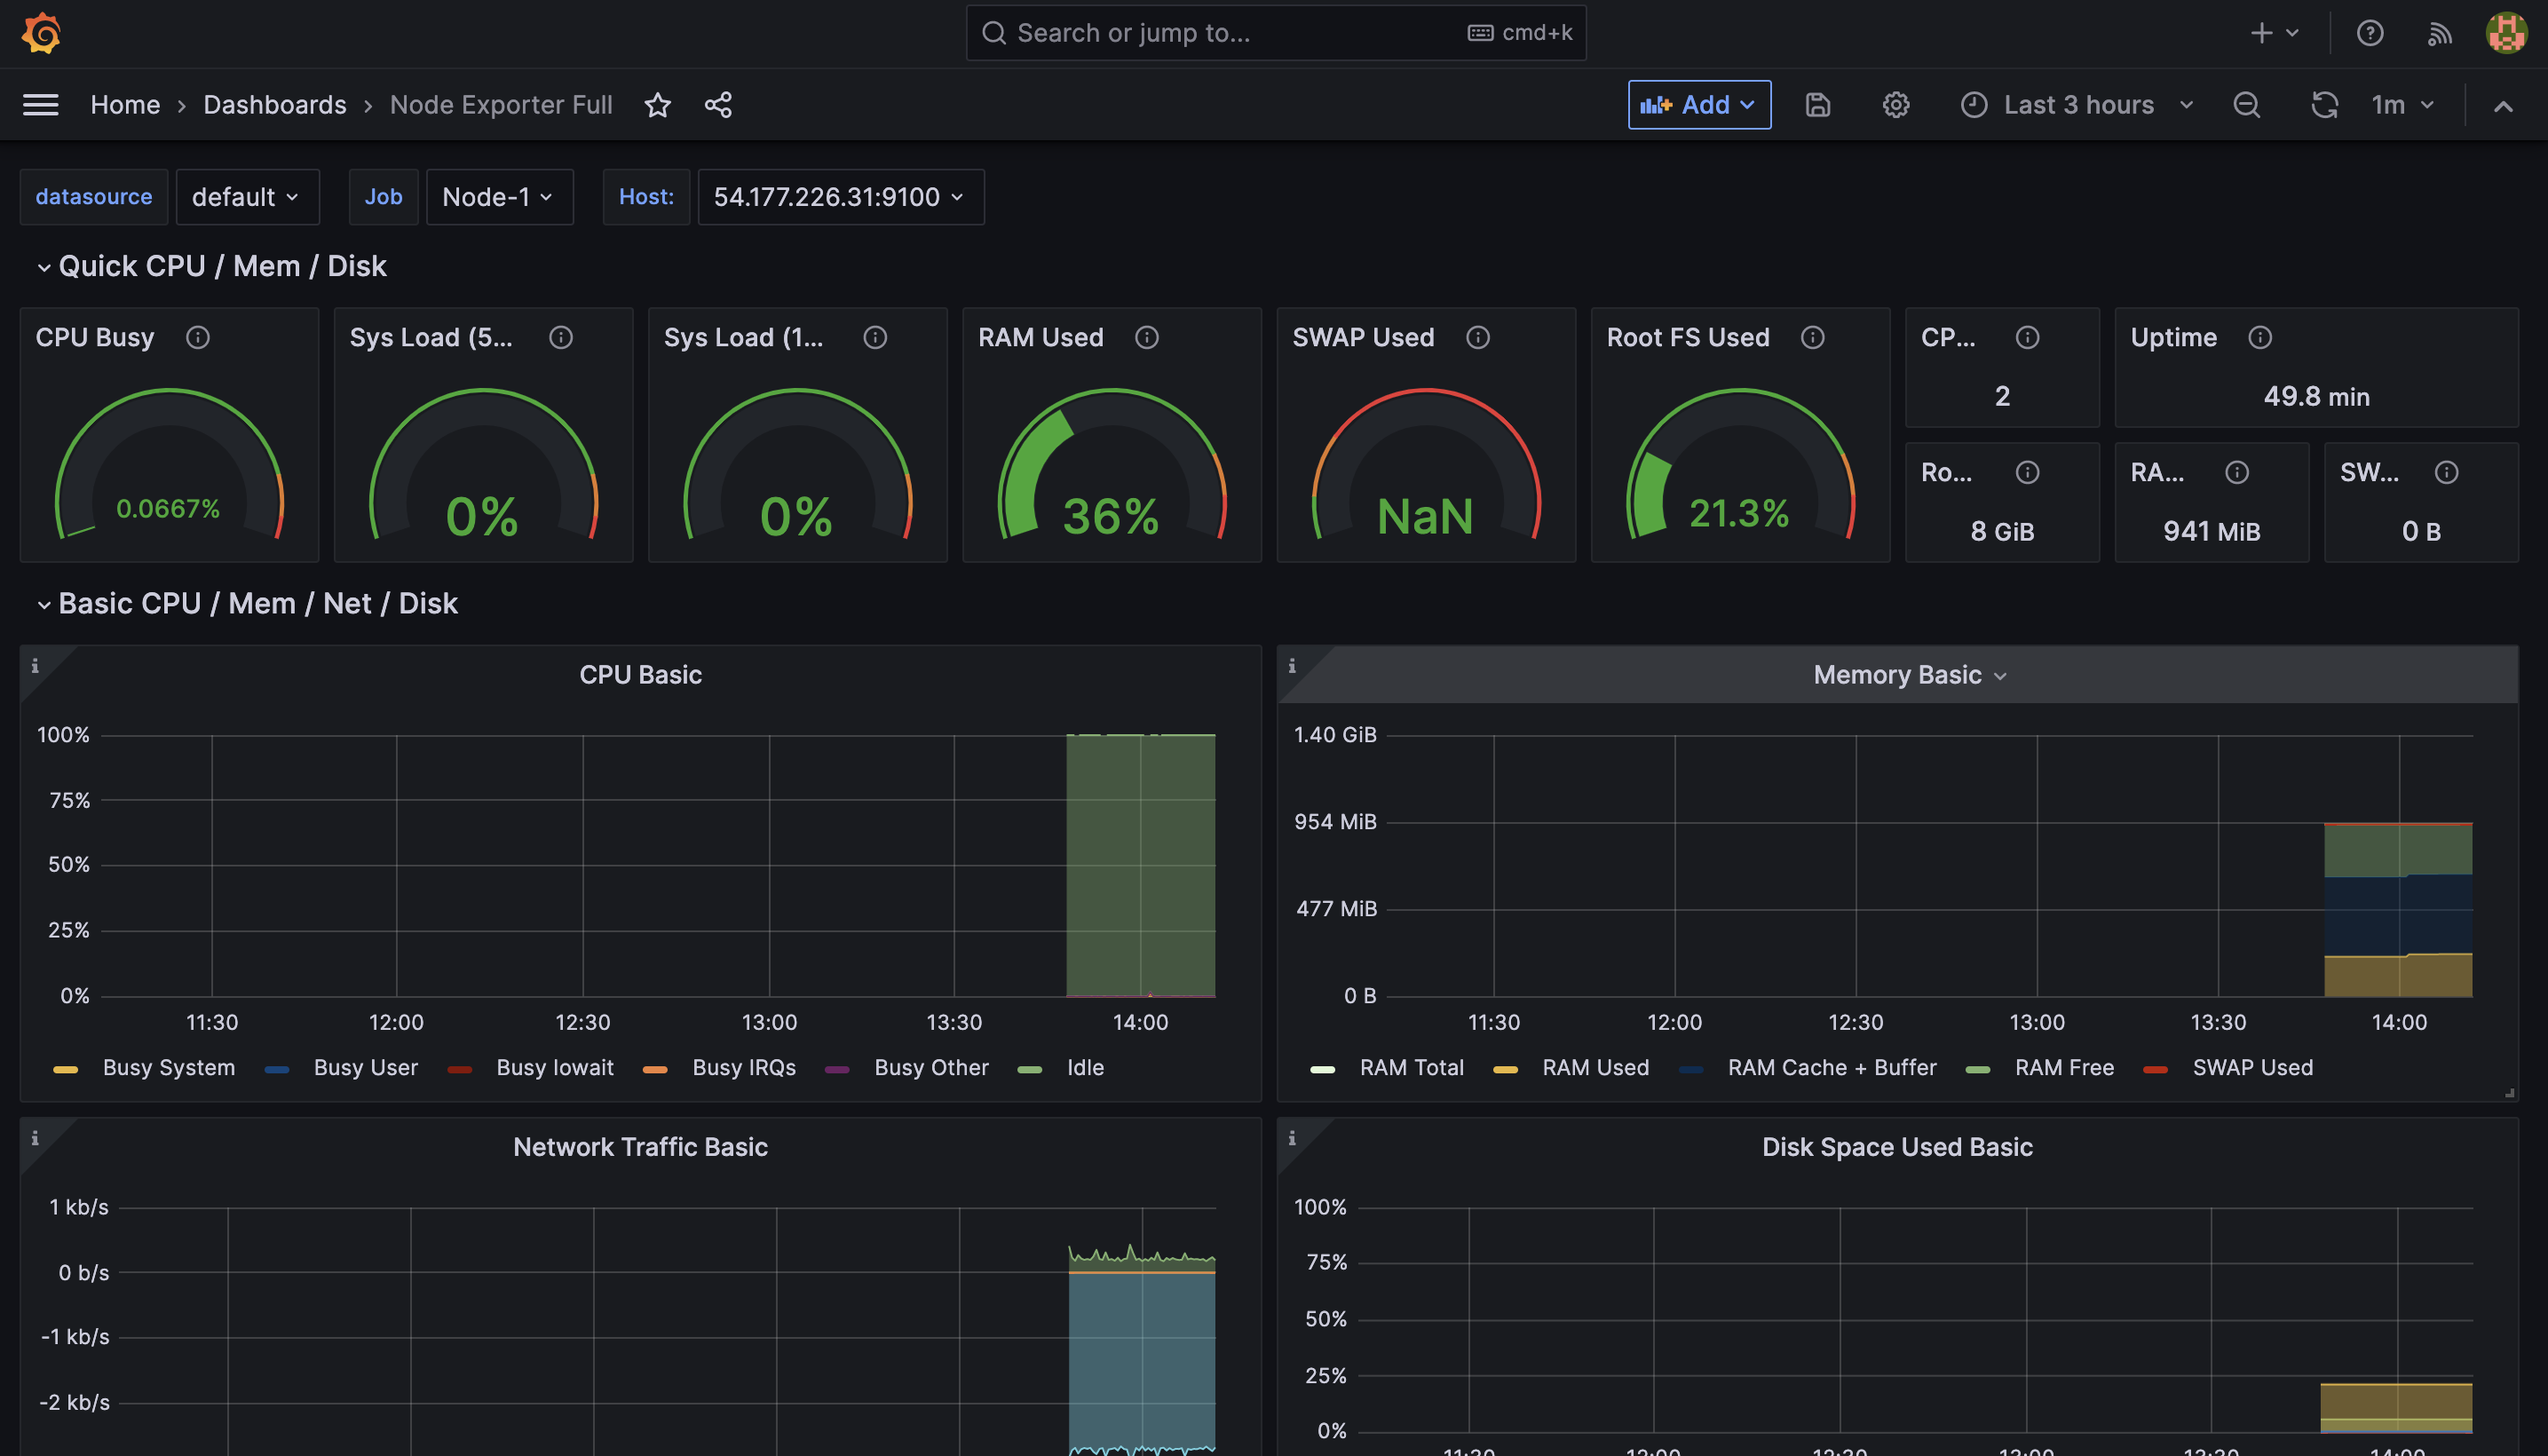
This dashboard shows the CPU usage, CPU request commitment, limitations, memory usage, memory request commitment, and memory limit commitment of the monitored node (node-1). It will help you manage and monitor.
Triggering Alert-System
Your monitoring system is now operational. It’s time to evaluate your configuration by activating some alerts from your defined alerting rules. To proceed with this, sign in to the monitored node (node-1) and execute the given command. The high_cpu_utilization alert can be initiated by leveraging the stress utility, which will mimic excessive CPU consumption.
sudo apt update && sudo apt install stress
## update and the install stress

stress --cpu 2 --timeout 60s
## You might need to increase CPU depending on the size of your node
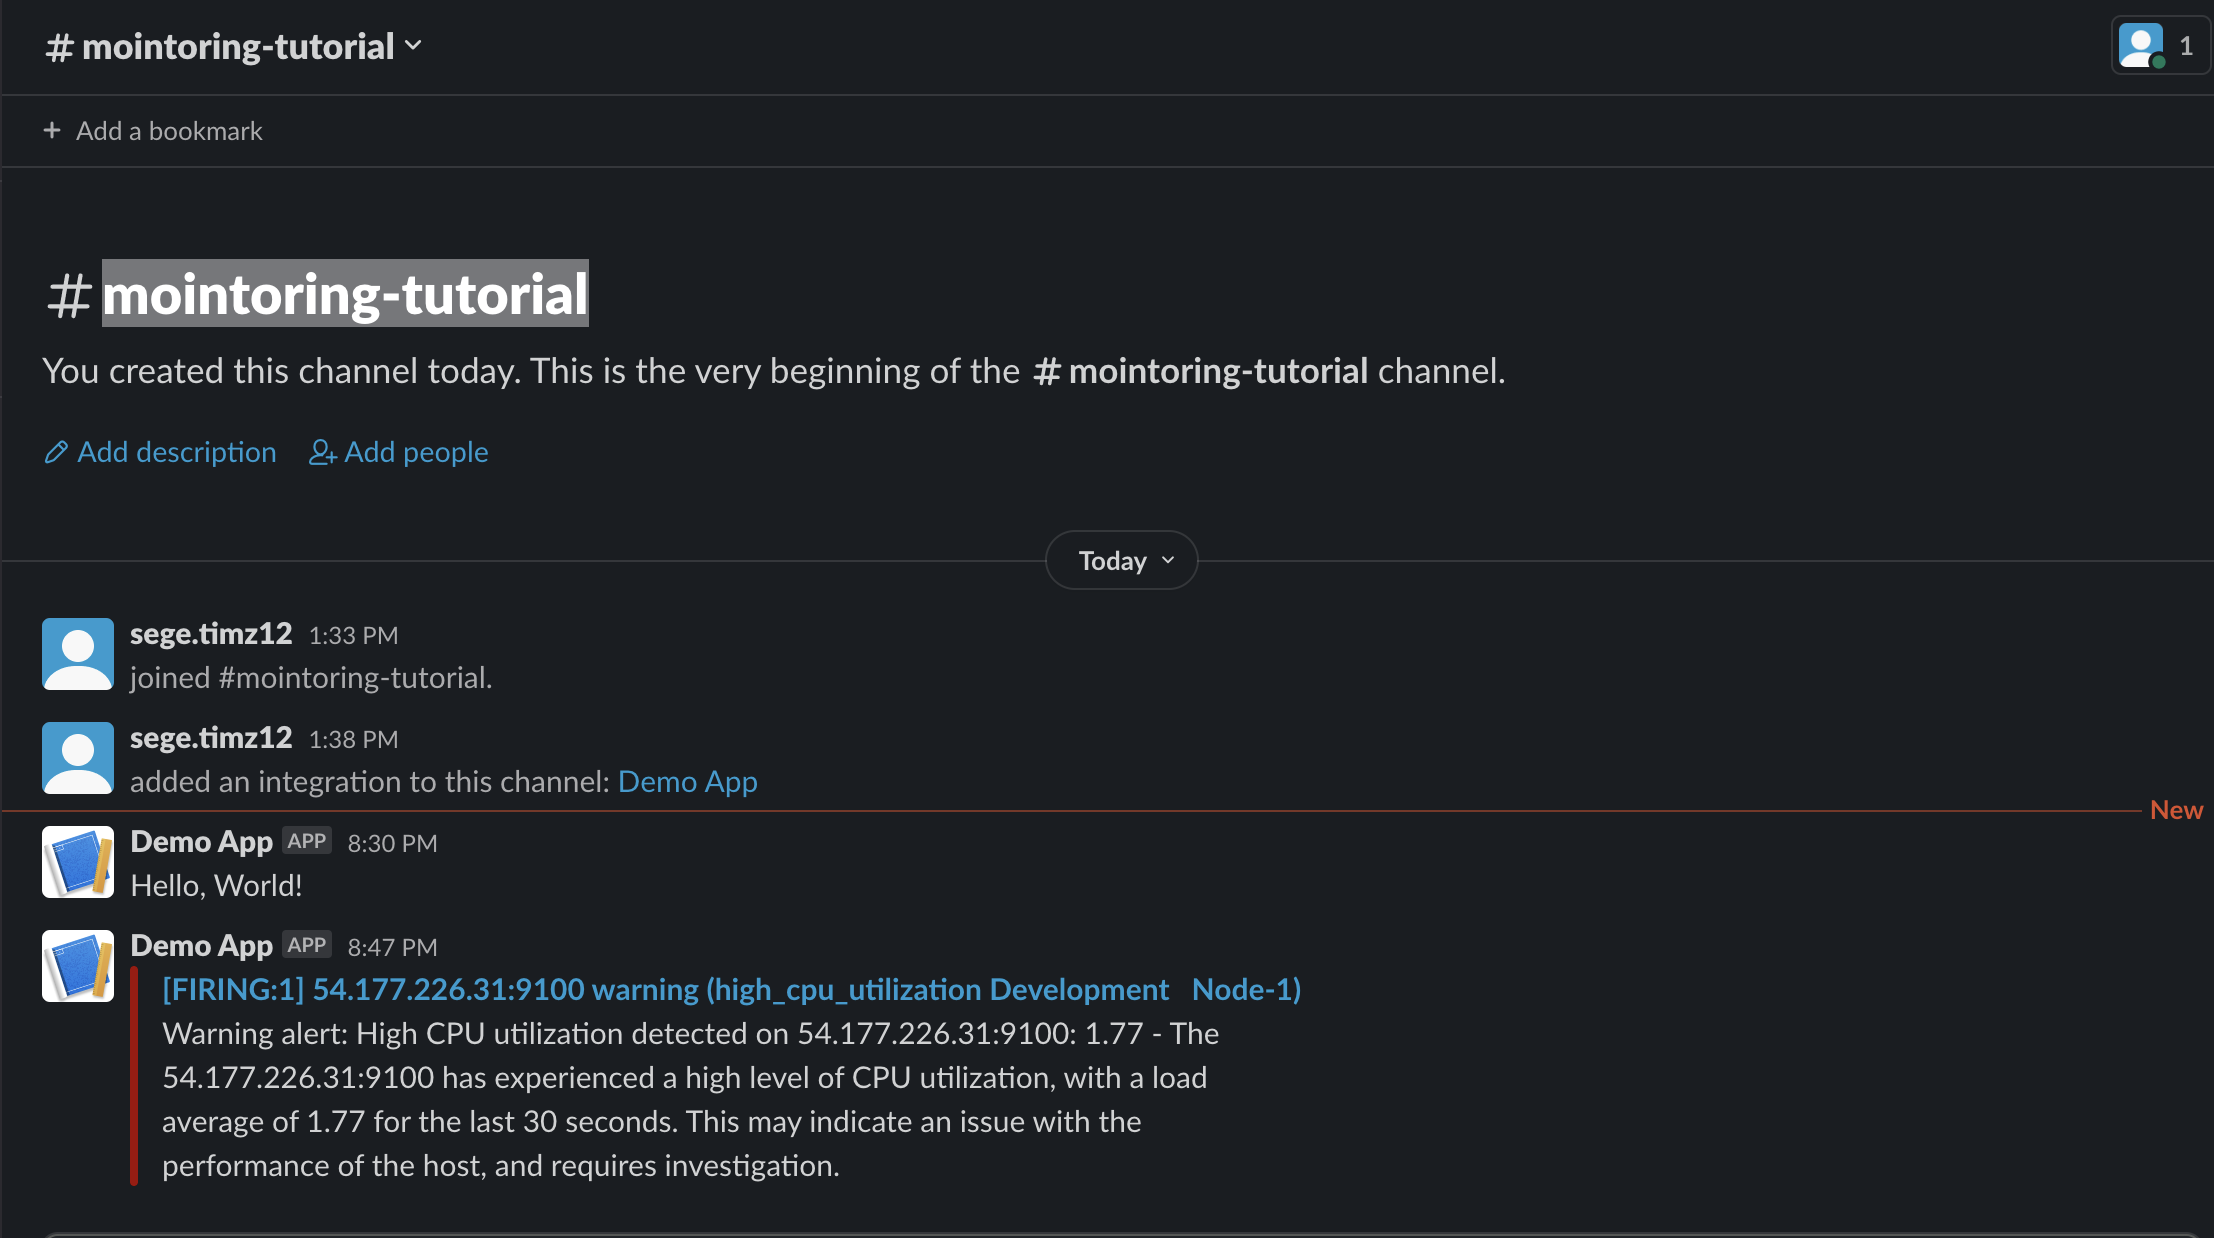
Wait a few minutes and Check the Slack channel you created, you should have received a warning alert telling you the error and which node it occurs on.
Conclusion
This guide walked you through creating a custom monitoring stack using Prometheus, Grafana, and Alertmanager, setting up alerting rules, as well as starting the stack using Docker Compose. You also learned to access and use Prometheus and Grafana web UIs and to import Grafana dashboards.
Looking for a boost in your build process? Give Earthly a go. It could be a perfect ally to your monitoring setup, enhancing your build automation and making your development process more efficient.
To further expand your skills, explore concepts like log aggregation, distributed tracing, and machine learning-based anomaly detection. Consider tools like Loki, Fluentd, and Jaeger for log and tracing analysis. Remember, monitoring needs continuous attention and tweaking for optimum performance.
Earthly makes CI/CD super simple
Fast, repeatable CI/CD with an instantly familiar syntax – like Dockerfile and Makefile had a baby.


