Distributed Tracing in Kubernetes With SigNoz
We’re Earthly. We make building software simpler and therefore faster using containerization. Check it out.
Debugging an application can be stressful, especially when your application runs on a large distributed system with multiple separate components. Some of these components are written in different languages and use different frameworks with different logging mechanisms. This makes it hard to debug when something goes wrong. You have to jump between different tools, run each component in separate terminals, check their logs, and try to put everything together to understand what went wrong. This can be made easier with distributed tracing. Distributed tracing allows you to see the flow of data between the different components in your application and understand how they interact with each other. It provides insight into where things are going wrong and allows you to debug problems on a whole new level. In this article, you will learn what distributed tracing is, how it works, and how you can set it up in your kubernetes cluster.
What Is Distributed Tracing?
Distributed tracing is a technique for understanding the interactions between different components in a distributed system. It provides a way to visualize the flow of data through services and processes. When an error occurs in one part of your application, you can use distributed tracing to identify all other parts of the system that are affected by it. This allows you to find the root cause more quickly and reduces the impact on other users and systems when you have to roll back changes. It can also be used to identify bottlenecks in your system by examining which functions take too long to execute or are too slow under certain conditions. This will allow you to improve the performance of your application while also lowering costs through resource optimization.
How Distributed Tracing Works?
Distributed tracing sounds great, but how does it manage to track every request through the entire system? The answer is that it does so by using multiple tracers, each of which is a program running alongside the actual application it is tracing . These tracers are usually deployed as part of your application or service or the distributed system itself; they monitor all requests and responses and send them to one central location for analysis.
A distributed tracing system consists of 3 layers:
- Span
- Tags
- Trace
Span
A span represents an execution of a specific unit of work (e.g. HTTP call). Each span has a start and end timestamp, as well as a unique identifier. The span also contains information about the request and response, including the HTTP headers and body data. A span may be associated with one or more tags that help identify its purpose. For example, you could tag a span with the name of the function it calls, the kind of resource it uses, or which user initiated it.
Tags
These are key-value pairs that provide additional information about spans. They can be used to associate spans with one another as well as add context to them. For example, tags can be used to track who initiated a request by adding their username as a tag on every transaction where they appear as an initiator.
Trace
A trace represents all spans associated with each other within an interval. A trace may start when an application calls a microservice (a small, self-contained service), which then forwards the request to another microservice or back to itself. The span will show how long it took for each microservice to complete its task before returning results to the original caller.
In summary, spans are portions of code that can be traced through the network. Tags are associated with spans, and they provide additional context about what’s happening with those spans. For example, a tag might indicate whether a span is related to an HTTP request or not. A trace is built from spans and tags. If a trace can be described as the entire trip a request makes, spans are stops it took along the way, and tags are pieces of information about the stops. Now that you understand how distributed tracing works, you can move ahead to set it up on your kubernetes cluster.
Setting up Distributed Tracing on Your Cluster

Configuring distributed tracing involves installing Application performance Monitoring Agents (APM) on every microservices that is needed to be traced. Since each microservices can run on separate programming languages, the corresponding APM agents will need to be installed.
For this article, a sample microservice will be used to demonstrate how you can set up distributed tracing. This demo is a simple NodeJs application with three services:
- Frontend service
- Backend service 1
- Backend service 2
In the setup, the frontend service and backend service 1 are exposed for external requests, while the backend service 2 is not but can be accessed through the backend service 1.
For the distributed tracing collection, management, and virtualization, you will use Signoz. Signoz is an open source Metrics, Tracing, and Logging tool for distributed systems. It makes use of OpenTelemetry API to collect metrics, trace, and log information. For this to happen, OpenTelemetry SDKs are installed in individual components of the distributed system and used to collect traces and metrics specific to those components. Traces from each component are then sent to SigNoz, which acts as a centralized server, where they can be collectively analyzed and virtualized.
The data collected by Signoz can easily be analyzed and visualized on its dashboard. To get started, you will set up Signoz on your cluster using helm charts.
First, add the SigNoz helm repository:
helm repo add signoz https://charts.signoz.ioNext, create a namespace that would house SigNoz resources:
kubectl create ns platformThen, deploy SigNoz using helm:
helm --namespace platform install my-release signoz/signozYou should see an output similar to this:
NAME: my-release
LAST DEPLOYED: Mon May 23 20:34:55 2022
NAMESPACE: platform
STATUS: deployed
REVISION: 1
NOTES:
1. You have just deployed the SigNoz cluster:

- frontend version: '0.8.0'
- query-service version: '0.8.0'
- alertmanager version: '0.23.0-0.1'
- otel-collector version: '0.43.0-0.1'
- otel-collector-metrics version: '0.43.0-0.1'
Verify that the installation is complete:
kubectl -n platform gets podsYou should see an output similar to this:
NAME                                                        READY   STATUS    RESTARTS   AGE
chi-signoz-cluster-0-0-0                                    1/1     Running   0          8m21s
clickhouse-operator-8cff468-n5s99                           2/2     Running   0          8m55s
my-release-signoz-alertmanager-0                            1/1     Running   0          8m54s
my-release-signoz-frontend-78774f44d7-wl87p                 1/1     Running   0          8m55s
my-release-signoz-otel-collector-66c8c7dc9d-d8v5c           1/1     Running   0          8m55s
my-release-signoz-otel-collector-metrics-68bcfd5556-9tkgh   1/1     Running   0          8m55s
my-release-signoz-query-service-0                           1/1     Running   0          8m54s
my-release-zookeeper-0                                      1/1     Running   0          8m54s
Finally, you need to expose SigNoz frontend service so you can have access to its dashboard:
export SERVICE_NAME=$(kubectl get svc --namespace platform -l "app.kubernetes.io/component=frontend" -o jsonpath="{.items[0].metadata.name}")

kubectl --namespace platform port-forward svc/$SERVICE_NAME 3301:3301
This assumes you are on your local host or you have direct access to the machine that runs the kubectl client. For production scenarios, you should expose the service using ingress.
Your SigNoz dashboard should be accessible from localhost:3310. Setup a new account and gain access to the dashboard

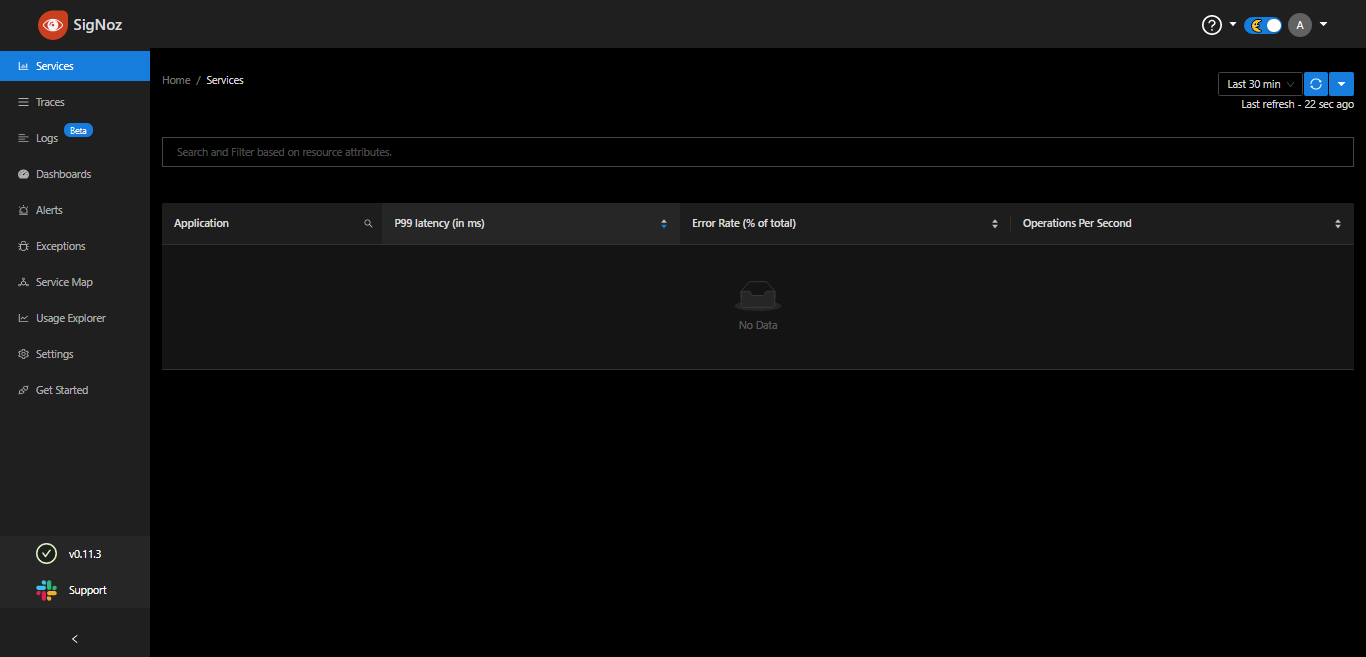
At this stage, SigNoz is running but not receiving any data. To make that happen, the service must be instrumented with OpenTelemtry APM agents that can send tracing and metric data to the SigNoz instance.
To continue, you need to set up the sample microservice and instrument each service with an APM agent.
In this tutorial, only Javascript APM agent instrumentation will be demonstrated because the sample microservices run on NodeJs. To instrument applications running on other languages like PHP, Python, Java, Golang, etc., follow this documentation on SigNoz.
To set up the sample microservice, clone the repo and change the directory to it
git clone https://github.com/Doctordrayfocus/kubernetes-microservices.git && \
cd kubernetes-microservices
Here is the directory structure of the sample microservice
.
├── backend-api1            NodeJS backend service 1.
│   └── API                 REST API.
├── backend-api2            NodeJS internal backend service 2.
│   ├── API                 REST API.
├── docs                    Documentation
├── frontend                NodeJS hosted webapp.
├── kubernetes              Kubernetes installation scripts to set up the application to kubernetes.
├── docker-compose.yml      Docker compose to setup application to docker.
Next, instrument the frontend service. To do this, you must install and activate the OpenTelemetry SDK in the application so that it can send metrics and traces to the centralized server (SigNoz).
First, initialize OpenTelemetry by creating a new file tracing.js in the root folder of the frontend service,
  // tracing.js
  'use strict'
  const process = require('process');
  const opentelemetry = require('@opentelemetry/sdk-node');
  const { getNodeAutoInstrumentations } = require('@opentelemetry/auto-instrumentations-node');
  const { OTLPTraceExporter } = require('@opentelemetry/exporter-trace-otlp-http');
  const { Resource } = require('@opentelemetry/resources');
  const { SemanticResourceAttributes } = require('@opentelemetry/semantic-conventions');


  const exporterOptions = {
    url: 'http://my-release-signoz-otel-collector.platform.svc.cluster.local:4318/v1/traces'
  }


  const traceExporter = new OTLPTraceExporter(exporterOptions);
  const sdk = new opentelemetry.NodeSDK({
    traceExporter,
    instrumentations: [getNodeAutoInstrumentations()],
    resource: new Resource({
      [SemanticResourceAttributes.SERVICE_NAME]: 'frontend'
    })
    });

sdk.start()
    .then(() => console.log('Tracing initialized'))
    .catch((error) => console.log('Error initializing tracing', error));

    // gracefully shut down the SDK on process exit
    process.on('SIGTERM', () => {
      sdk.shutdown()
      .then(() => console.log('Tracing terminated'))
      .catch((error) => console.log('Error terminating tracing', error))
      .finally(() => process.exit(0));
      });
The http://my-release-signoz-otel-collector.platform.svc.cluster.local:4318 is the url of the SigNoz collector since the application and SigNoz are both running on the same cluster. [SemanticResourceAttributes.SERVICE_NAME]: 'backend_service_1' defines the name of the service. This should be unique across all services because it is used to differentiate and sort traces and metrics for every service.
Next, open the frontend->Dockerfile in a code editor of your choice, add OpenTelmetry packages after RUN npm install --silent, and tracing.js to the startup script. The Docker file should now look like the following:
FROM node:15-alpine

LABEL version="1.0.0"
ARG basedir="frontend"
ENV NODE_ENV production
WORKDIR ${basedir}/ .

# Copy package.json
COPY ${basedir}/package*.json ./

# Install npm packages
RUN npm install --silent

# Setup open telemetry
RUN npm install --save @opentelemetry/sdk-node
RUN npm install --save @opentelemetry/auto-instrumentations-node
RUN npm install --save @opentelemetry/exporter-trace-otlp-http

# Copy project files to the workdir.
COPY ${basedir}/ .

# Install bash inside the container. Only if you need to debug the app inside of the container.
RUN apk update && apk add bash

EXPOSE 9000
# Startup script with tracing.js
CMD node -r ./tracing.js server.js
Similar configurations need to be made to both backend-api1 and backend-api2 services so that they can also send traces and metrics to SigNoz.
To continue, create a new tracing.js file in the backend-api1 folder and add the initialization code. The initialization code is similar to that of the frontend-service. Copy and paste the tracing.js content and change the service name to backend_service_1
  // tracing.js
…
    resource: new Resource({
      [SemanticResourceAttributes.SERVICE_NAME]: 'backend_service_1'
    })
…
Then, add OpenTelmetry packages after RUN npm install --silent and tracing.js to the startup script.
…
# Setup open telemetry
RUN npm install --save @opentelemetry/sdk-node
RUN npm install --save @opentelemetry/auto-instrumentations-node
RUN npm install --save @opentelemetry/exporter-trace-otlp-http

...
# Startup script with tracing.js
CMD node -r ./tracing.js server.js
Finally, for backend_service_2, copy and paste the tracing.js content from the frontend service and change the service name to backend_service_2
  // tracing.js
…
   resource: new Resource({
      [SemanticResourceAttributes.SERVICE_NAME]: 'backend_service_2'
    })
   …
And for the Dockerfile, add OpenTelemetry packages and tracing.js to the startup script.
…
# Setup open telemetry
RUN npm install --save @opentelemetry/sdk-node
RUN npm install --save @opentelemetry/auto-instrumentations-node
RUN npm install --save @opentelemetry/exporter-trace-otlp-http

…
# Startup script with tracing.js
CMD node -r ./tracing.js server.js
Now, it is time to send traces and metrics to SigNoz and for this to happen, the sample microservice needs to be running on the cluster. To build the docker images for the services, run the build script in the project kubernetes-microservices folder.
./build.sh_"} ./kubernetes/install.sh ~~~
You should get an output similar to this
service/backend-api-1-svc created
service/backend-api-2-svc created
service/frontend-svc created
deployment.apps/backend-api-1 created
deployment.apps/backend-api-2 created
deployment.apps/frontend created
Check if the services are running
Kubectl get podsYou should see an output like this
backend-api-1-6dbd4dc47-bwjv6    1/1     Running   0             74s
backend-api-2-7c5b9f9d4d-wrnzx   1/1     Running   0             24s
frontend-695cc55cdf-f8nqs        1/1     Running    0            24s
Next, expose the frontend service for external requests, so you can access it directly at localhost:3000
kubectl port-forward svc/frontend-svc 3000:80Also, expose the backend service for an external request, so you can access it at localhost:3001
kubectl port-forward svc/backend-api-1-svc 3001:80Load both the frontend at localhost:3000 and the backend at localhost:3001/api/message multiple times to generate enough traces and metrics that will be sent to Signoz.
This article assumes you are on your local host or you have direct access to the machine that is running kubectl. In a production setting, you can expose a service for external requests using ingress
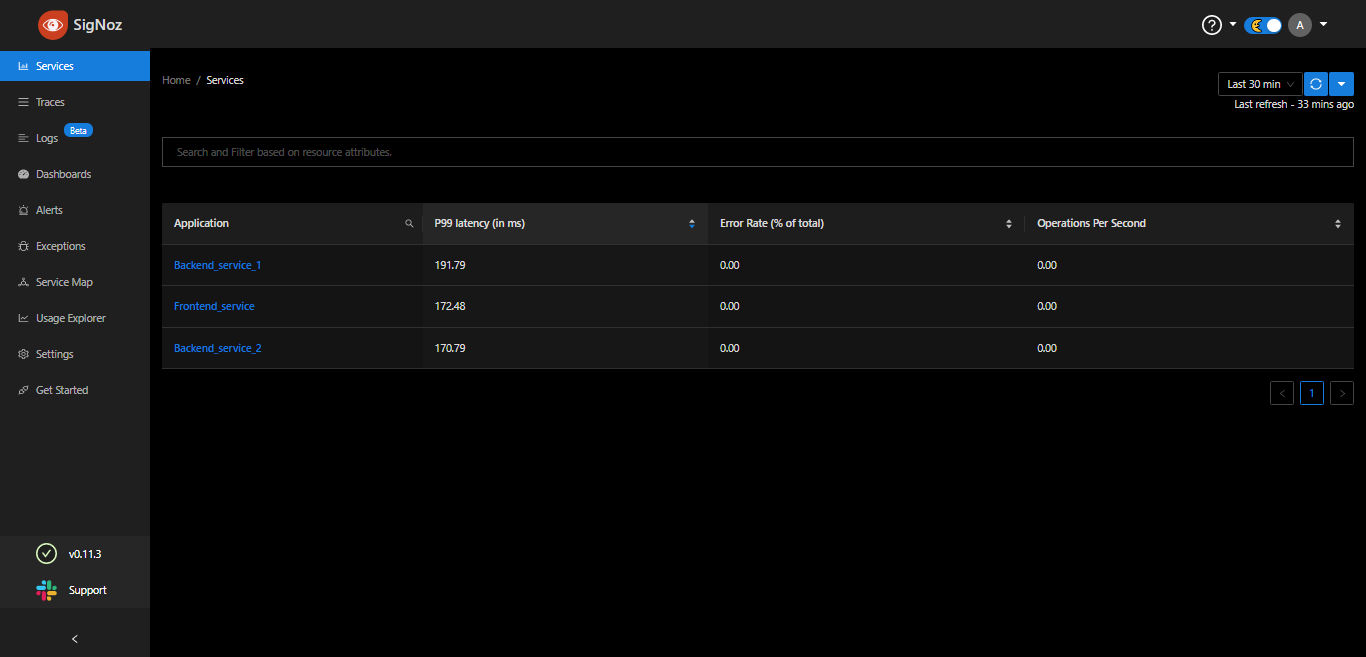
Finally, your microservices are running and sending tracing data to SigNoz. To confirm this, go back to your SigNoz dashboard at localhost:3301 (or the other external url if you expose using ingress), and sign in if you are not already. All your services should now show up on the dashboard like below.

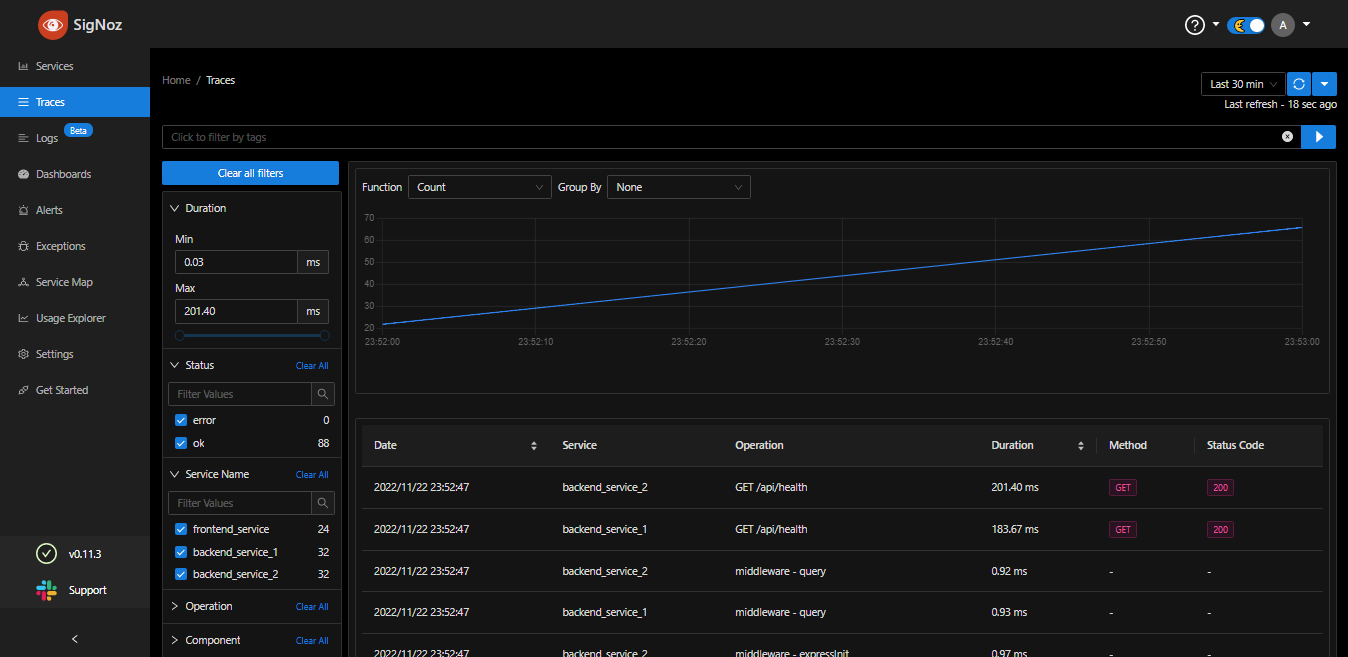
To see your application traces, go to the Traces section on the dashboard. This will show you all traces for every request or transaction in every service and their corresponding duration.

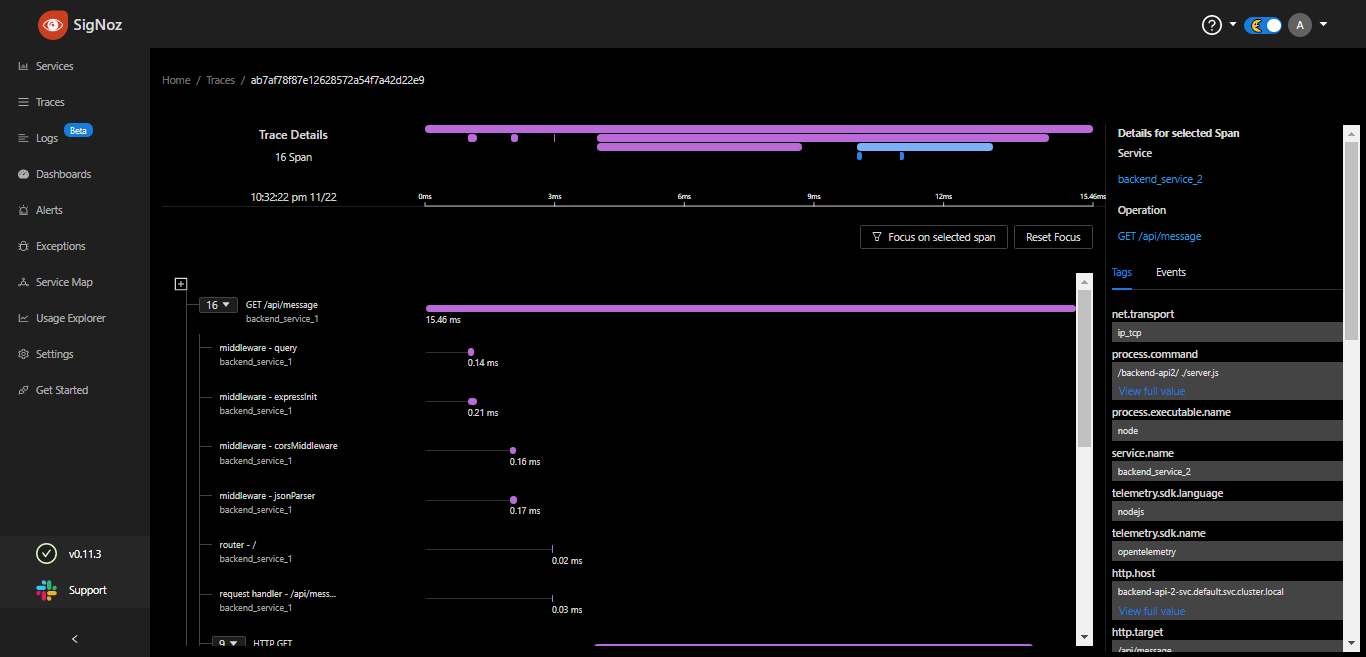
You can also expand into a trace to see the various spans and their corresponding tags that make up the trace.

There are many other features like alerting, custom dashboard, and service mapping on SigNoz that you can use to better analyze and visualize your tracing data.
Conclusion
In this tutorial, we’ve covered the definitions, importance, and workings of distributed tracing. We’ve also delved into its three components: spans, tags, and traces. Lastly, we have guided you through the setup process of distributed tracing on your cluster using Signoz and Application Performance Monitoring agents on each required microservice.
As you continue to optimize your microservices, you might also want to consider improving your build processes. If that’s the case, give Earthly a shot. It’s a tool designed to streamline and enhance your build automation, making it an excellent companion for managing complex, multi-component projects.
Earthly makes CI/CD super simple
Fast, repeatable CI/CD with an instantly familiar syntax – like Dockerfile and Makefile had a baby.


