Log Aggregation with Grafana Loki on Kubernetes
We’re Earthly. We make building software simpler and therefore faster using containerization. Give it a look.
As the application deployment landscape becomes more complex, monitoring system logs becomes even more important. From system and application logs to security events and performance metrics, this data contains valuable insights that can help organizations make informed decisions and optimize their operations. However, managing, and analyzing this data can be a daunting task, especially as the volume of data continues to grow.
This is where log aggregation comes into play. By collecting and centralizing log data from various sources, log aggregation tools make it easier to manage and analyze log data, leading to faster troubleshooting, better security, and improved operational efficiency. Grafana Loki is a powerful and flexible log aggregation tool
In this article, you will learn what log aggregation is, and how Grafana Loki can be used as a complete log aggregation solution in Kubernetes. You’ll learn about the key features of Grafana Loki and how it works, and a step-by-step guide on how to set it up for your Kubernetes cluster.
Let’s get started!
What Is Log Aggregation?
Log aggregation is the process of gathering, processing, and storing log data from various IT settings to streamline log analysis and store it in a single location. This makes it simpler for businesses to monitor their systems, applications, and networks by enabling them to view, analyze, and handle their log data in a unified way.
Developers would have to manually prepare, organize, and look through log data from numerous sources – to extract useful information – if log aggregation didn’t exist.
Why Do You Need to Aggregate Logs?
Log aggregation is important for any organization that wants to manage and analyze its log data effectively. There are several reasons why log aggregation is essential:
The visibility and organization of log data are improved by log aggregation. Searching, visualizing, and analyzing log data that is strewn across a number of different systems can be challenging. By centralizing all your log data in one place, log aggregation makes it easier to keep track of potential issues and respond to incidents quickly. You can set up alerts to notify you of critical events, and you can quickly access relevant log data to investigate problems.
Aggregating logs improves security. You can learn more about the behavior of your system, including any possible security risks, by aggregating logs. This keeps your systems and data secure by making it simpler to identify and address security incidents. For instance, log aggregation can be used to trace changes to crucial systems, keep tabs on access to sensitive data, and look for indications of malicious activity.
Log aggregation helps organizations meet compliance and regulatory requirements. Many industries have regulations in place that require organizations to store and manage log data for a certain period of time. Log aggregation helps you meet these requirements and ensure you comply with industry regulations. By retaining your log data, you can demonstrate to auditors that you have met your legal obligations.
Monitoring performance is improved by log aggregation. Logs offer useful information about the functionality and access of your systems. By combining this data, you can spot patterns and trends that will help you prevent efficiency problems and make sure your systems are operating at their best. Log aggregation can be used to monitor system uptime, spot bottlenecks, and assess resource utilization.
Log aggregation is critical for incident response. When something goes wrong, you need to be able to quickly identify the root cause of the issue. By aggregating log data, you can trace the chain of events that led to the incident and pinpoint the source of the problem. This allows you to respond to incidents more effectively and minimize downtime.
In summary, by centralizing log data, organizations can improve visibility, enhance security, meet compliance requirements, monitor performance, and respond to incidents more effectively.
What Is Grafana Loki?
Loki is like Prometheus but for logs, as the Grafana Loki community says. It is an open-source log aggregation system that enables organizations to collect, store, and query log data efficiently and cost-effectively. Unlike traditional log aggregation systems, which typically rely on a centralized database to store logs, Loki uses a distributed architecture that leverages object storage systems like Amazon S3 or Google Cloud Storage to store logs.
Loki uses a unique indexing strategy that allows it to store logs in a highly compressed format. This reduces the amount of storage space required and allows Loki to handle much larger volumes of log data than traditional systems.
This architecture enables organizations to store log data cost-effectively while maintaining high availability and scalability. Additionally, since logs are stored as a series of streams rather than individual records, queries can be performed quickly and efficiently, even over vast amounts of Logs.
Grafana Loki was created using Prometheus’ architecture as a model, which makes use of labels to index data and stores indexes efficiently while taking up little physical room. In addition, Loki’s design is completely compatible with Prometheus, allowing programmers to use the same labeling standards on both systems.
How Does Grafana Loki Work?

At its core, Grafana Loki is a log aggregation system that is designed to handle large volumes of log data in a distributed environment. It is made up of three primary components: the Loki logs collector (Promtail), the Loki logs storage system, and the Grafana UI.
Promtail, the logs collector, is in charge of gathering logs from various sources, including apps, containers, servers, and network devices. It is highly configurable and can be configured to gather logs in various formats and from various sources, making it adaptable to various logging settings.
📑While Grafana Loki is intended to work seamlessly with Promtail, other log collectors such as Logstash and Vector can also be used. Grafana Labs’ Promtail, on the other hand, is the suggested log collector for Loki.
The Loki logs storage system is where the collected logs are processed, indexed, and stored for future retrieval. What makes Loki unique is its indexing and storage architecture, where each log line is indexed and stored in a key-value store. The index metadata contains all the information needed to search and retrieve logs quickly. Additionally, Loki supports tagging and labeling of log streams, which allows for easy identification and filtering of logs.
Finally, the Grafana UI provides a user-friendly interface for querying and visualizing log data. It integrates with Loki to provide a powerful, real-time search and visualization of logs. Grafana supports a range of functions for filtering, aggregation, and visualization of log data. Users can create custom dashboards and alerts based on log data, and share them with their team members.
Overall, Grafana Loki is a highly scalable and efficient log aggregation system that is designed for modern distributed systems. It allows for the collection and storage of large volumes of log data, and provides powerful search and visualization capabilities for easy analysis and troubleshooting. Its modular architecture and flexibility make it a popular choice for logging in various environments.
Understanding Loki Architecture
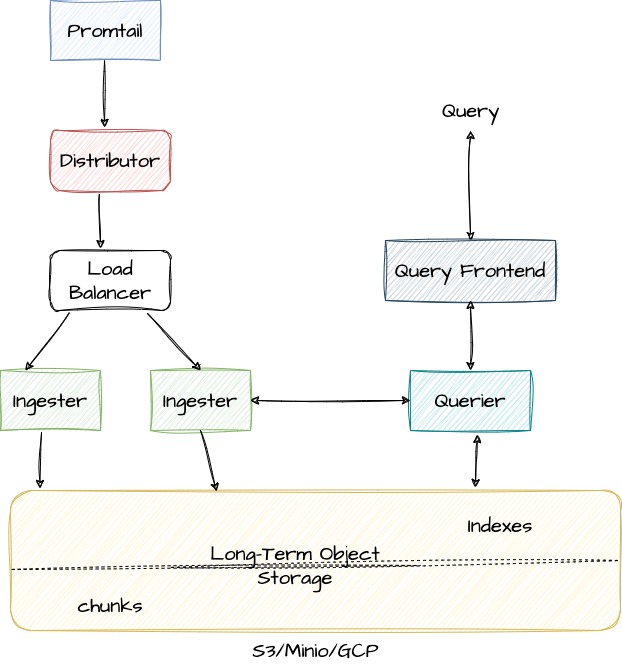
Loki architecture is composed of various components that work together to collect, store, and retrieve log data. Each component has a specific function and is designed to operate in a distributed, highly available environment. This approach allows Loki to scale horizontally and handle large volumes of log data while maintaining high performance and availability.
The Distributor
The first component, Distributor, receives log data from clients and forwards it to the appropriate ingester based on its labels. It also validates logs for the correctness and tenant limits, splits valid chunks into batches, and distributes them evenly across available Ingesters. By distributing log data across multiple ingesters, the Loki cluster can handle large volumes of log data while maintaining high availability and performance.
The Ingester
The Ingester is responsible for receiving log data from the Distributor and storing it on long-term storage backends. It creates log file chunks and an index of the log data based on the log stream’s labels, which enables queries to search and filter through log data based on specific labels or label combinations. The ingester component can be easily scaled horizontally to handle additional log data and upgraded without affecting the rest of the system.
Object Storage
Object Storage systems such as Amazon S3, Google Cloud Storage, and Microsoft Azure Blob Storage provide durable, highly available, and scalable storage for logs. Using Object Storage with Loki allows log data to be easily queried and analyzed across multiple clusters or regions, and enables higher levels of redundancy and fault tolerance compared to local disk storage.
Query Frontend
The Query Frontend is an optional service in Loki that provides a user interface for querying log data stored in the Loki system. When a user enters a query in the Query Frontend, it sends the query request to the Querier, which is responsible for executing the query and retrieving the results from the Distributor component, which in turn retrieves data from the different storage backends, including the long-term storage. The Query Frontend also supports features such as auto-completion, syntax highlighting, and error highlighting to help users write accurate and effective queries
Querier
The Querier plays a crucial role in querying log data from the ingester and the long-term storage system. It validates and parses queries, queries all ingesters for in-memory data, queries the backend store for the same data, and generates query results.
To improve query performance, the Querier applies batching and caching optimizations:
- It can improve query performance and reduce requests to the Loki storage system by batching queries together.
- Query results can also be cached to improve query performance by reducing the amount of data that must be retrieved from Loki.
Grafana Loki in Action
This section will walk you through setting up Grafana Loki and running simple LokiQL to check for error logs in your Kubernetes cluster. By the end of this section, you should have a Grafana Loki stack running in your Kubernetes environment.
Prerequisites
To follow along with this step-by-step tutorial, you should have the following:
- Local installation of Kubernetes and kubectl
- Local installation of Helm
Adding Grafana Helm Chart Repo
The first step is to add the Grafana helm repository as it will be used to install Grafana Loki to your cluster. To do so run the following commands:
## Add the Grafana Helm repository
helm repo add grafana https://grafana.github.io/helm-charts

## update the helm repo

helm update repo Grafana
Deploying Grafana Loki to Your Kubernetes Cluster
After adding the Grafana repository helm chart the next set is to use it to deploy the Grafana loki stacks to your cluster. Create a file named grafana-loki-values.yml on your desktop and paste the following configuration into it.
## grafana-loki-values.yml

loki:
  enabled: true
  isDefault: true

  url: http://{{(include "loki.serviceName" .)}}:{{ .Values.loki.service.port }}

  readinessProbe:
    httpGet:
      path: /ready
      port: http-metrics
    initialDelaySeconds: 45
  livenessProbe:
    httpGet:
      path: /ready
      port: http-metrics
    initialDelaySeconds: 45
  datasource:
    jsonData: "{}"
    uid: ""

promtail:
  enabled: true
  serviceMonitor:
    enabled: true
  config:
    logLevel: info
    serverPort: 3101
    clients:

      - url: http://{{ .Release.Name }}:3100/loki/api/v1/push


grafana:
  enabled: true
  sidecar:
    datasources:
      label: ""
      labelValue: ""
      enabled: true
      maxLines: 1000
  image:
    tag: 8.3.5
  ingress:
    enabled: true
    annotations:
      kubernetes.io/ingress.class: nginx
      nginx.ingress.kubernetes.io/ssl-redirect: "false"
    hosts:
      - grafana.example.com
  datasources:
    Loki:
      type: loki
      access: proxy
      url: http://loki.logging:3100
This code block is a YAML configuration file for deploying and configuring Grafana, Loki, and Promtail in your Kubernetes cluster. It defines the URLs and settings for each service, including the default data source for Grafana, the configuration for the Prometheus ServiceMonitor, and the Ingress resource used to expose Grafana. In summary, it specifies the necessary settings and parameters for these applications to run correctly in a Kubernetes environment.
After creating the grafana-loki-values.yml the next step is to apply the custom configuration. To do so, run the following command:
helm upgrade –install loki-logging grafana/loki-stack \
-n logging --create-namespace -f ~/desktop/grafana-loki-values.yml
You can confirm the Grafana Loki stacks by the following command:
kubectl get all -n logging 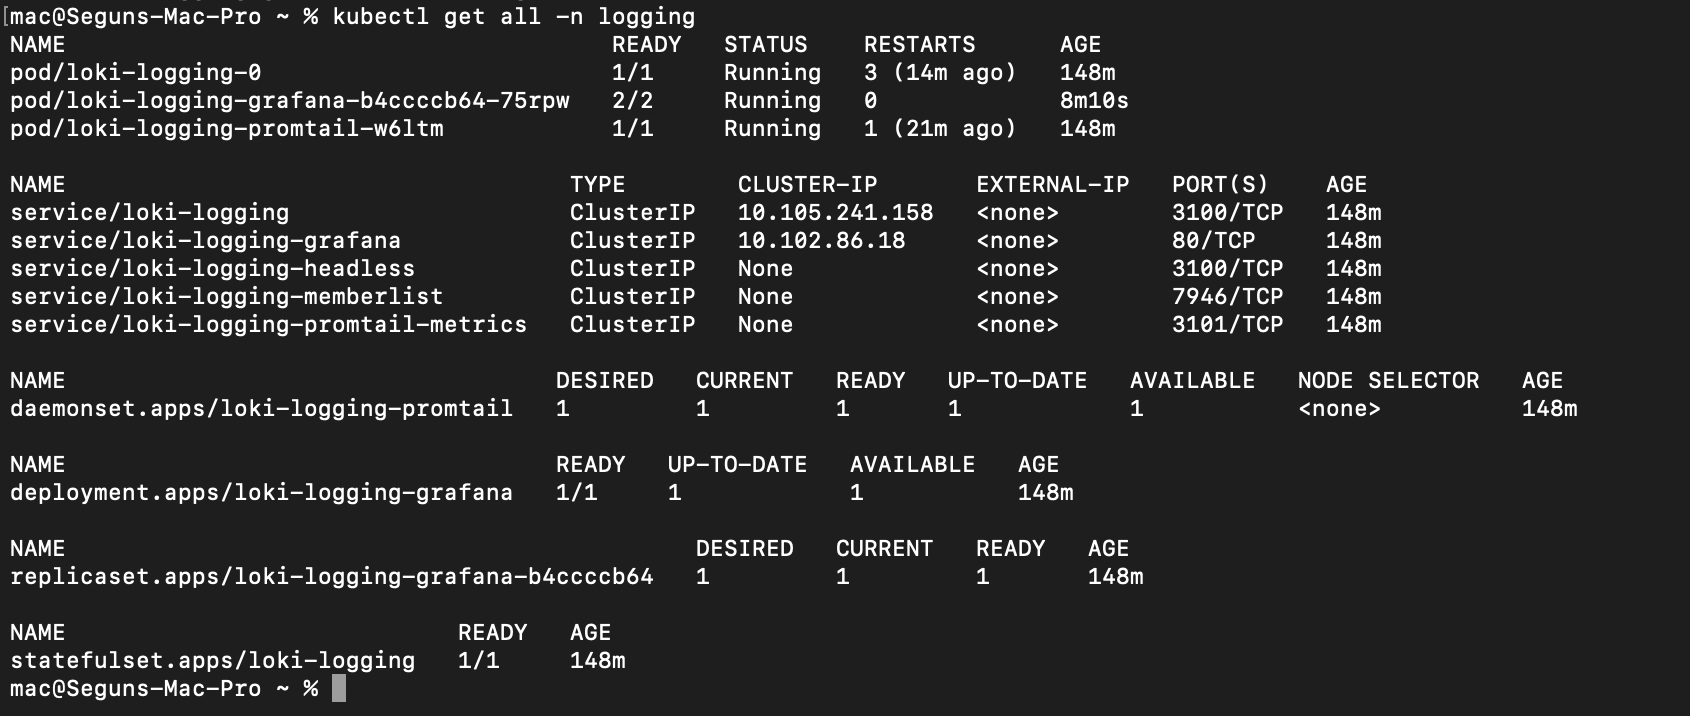
Accessing the Grafana UI
With the Grafana Loki stack now deployed in your cluster, you can begin querying Loki using the Grafana user interface (UI). To access the Grafana UI, you will need to obtain the password first. To do this, run the following command on a Mac or Linux system to retrieve the Grafana password:
kubectl get secret --namespace logging loki-logging-grafana \
-ojsonpath="{.data.admin-password}" | base64 --decode ; echo
If you’re on a windows machine run the following commands to get the encoded password and decode:
kubectl get secret --namespace logging loki-logging-grafana \
-ojsonpath="{.data.admin-password}" | echo
To access the Grafana UI locally, you need to forward traffic to it. In this guide, you’ll use the Kubernetes port-forward command:
kubectl port-forward service/loki-logging-grafana -n \
logging 3000:80
Open your favorite web browser and navigate to one of the following endpoints:
- http://localhost:3000 (local) – If you’re running a local Kubernetes cluster on your computer
- http://SERVER_IP:3000 (cloud) – If you’re running a Kubernetes cluster on a VM provisioned with a cloud provider. Replace with your server’s actual IP address.
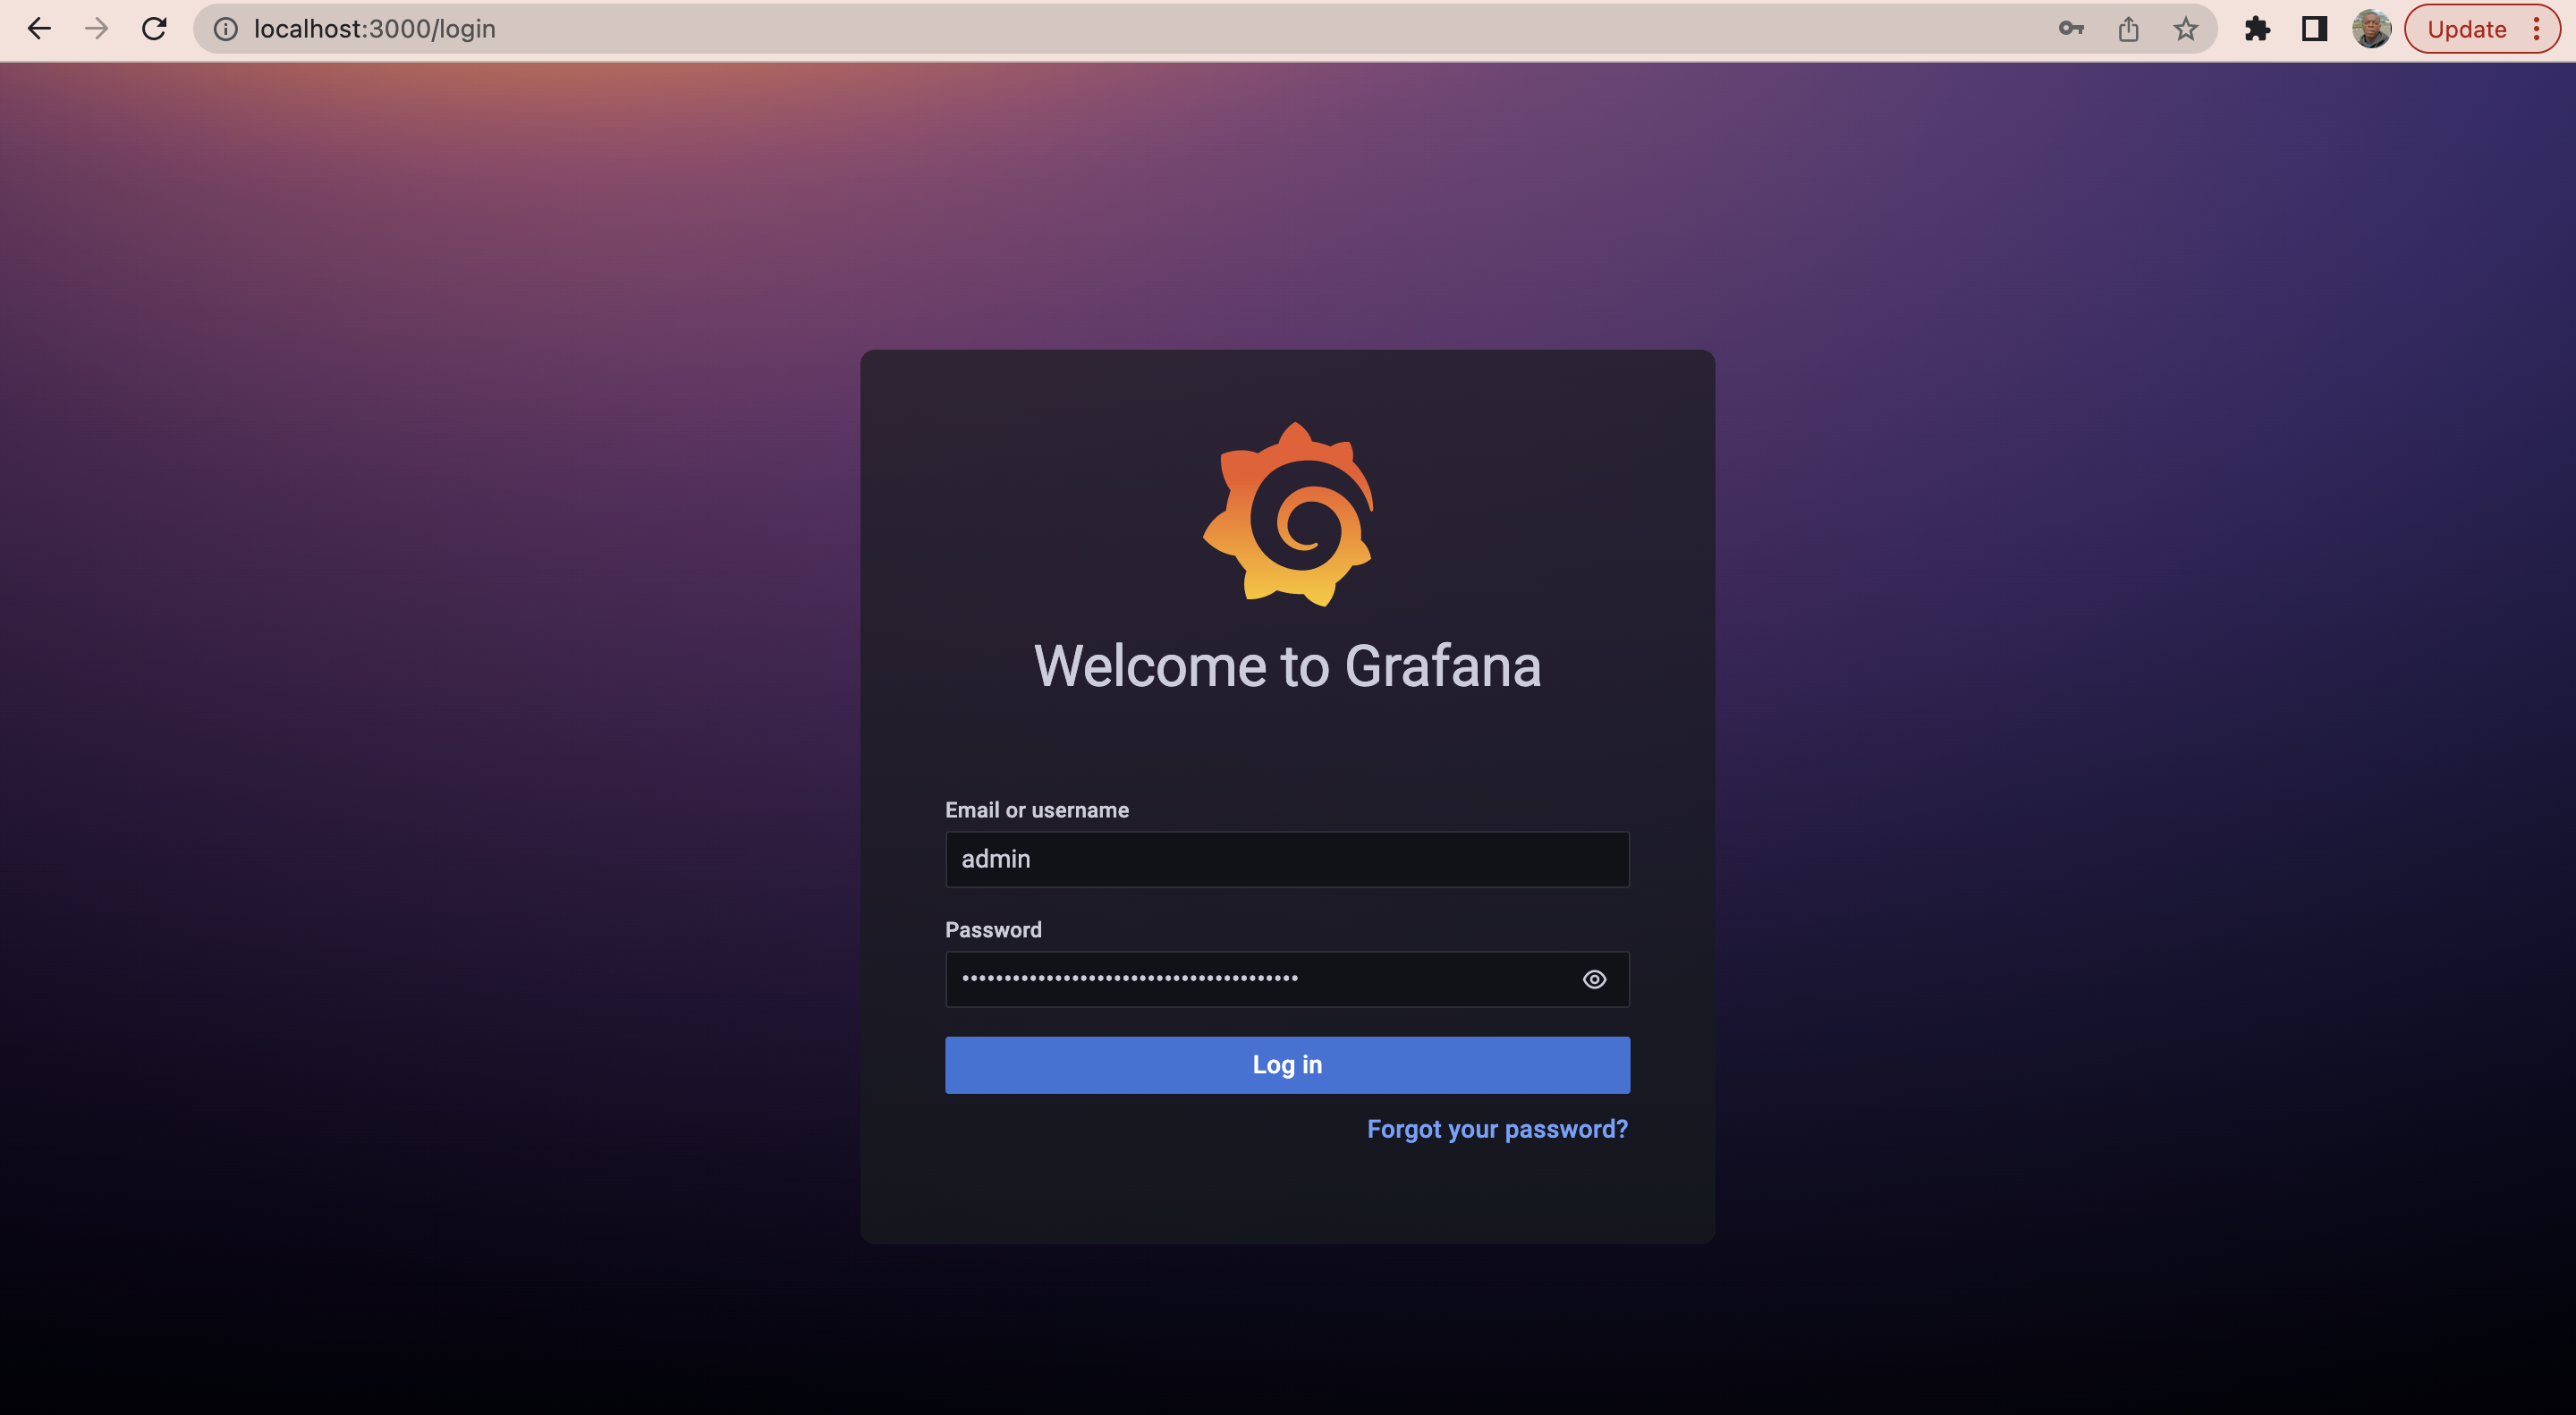
Next use the username admin and the password is the decoded password you obtained earlier.
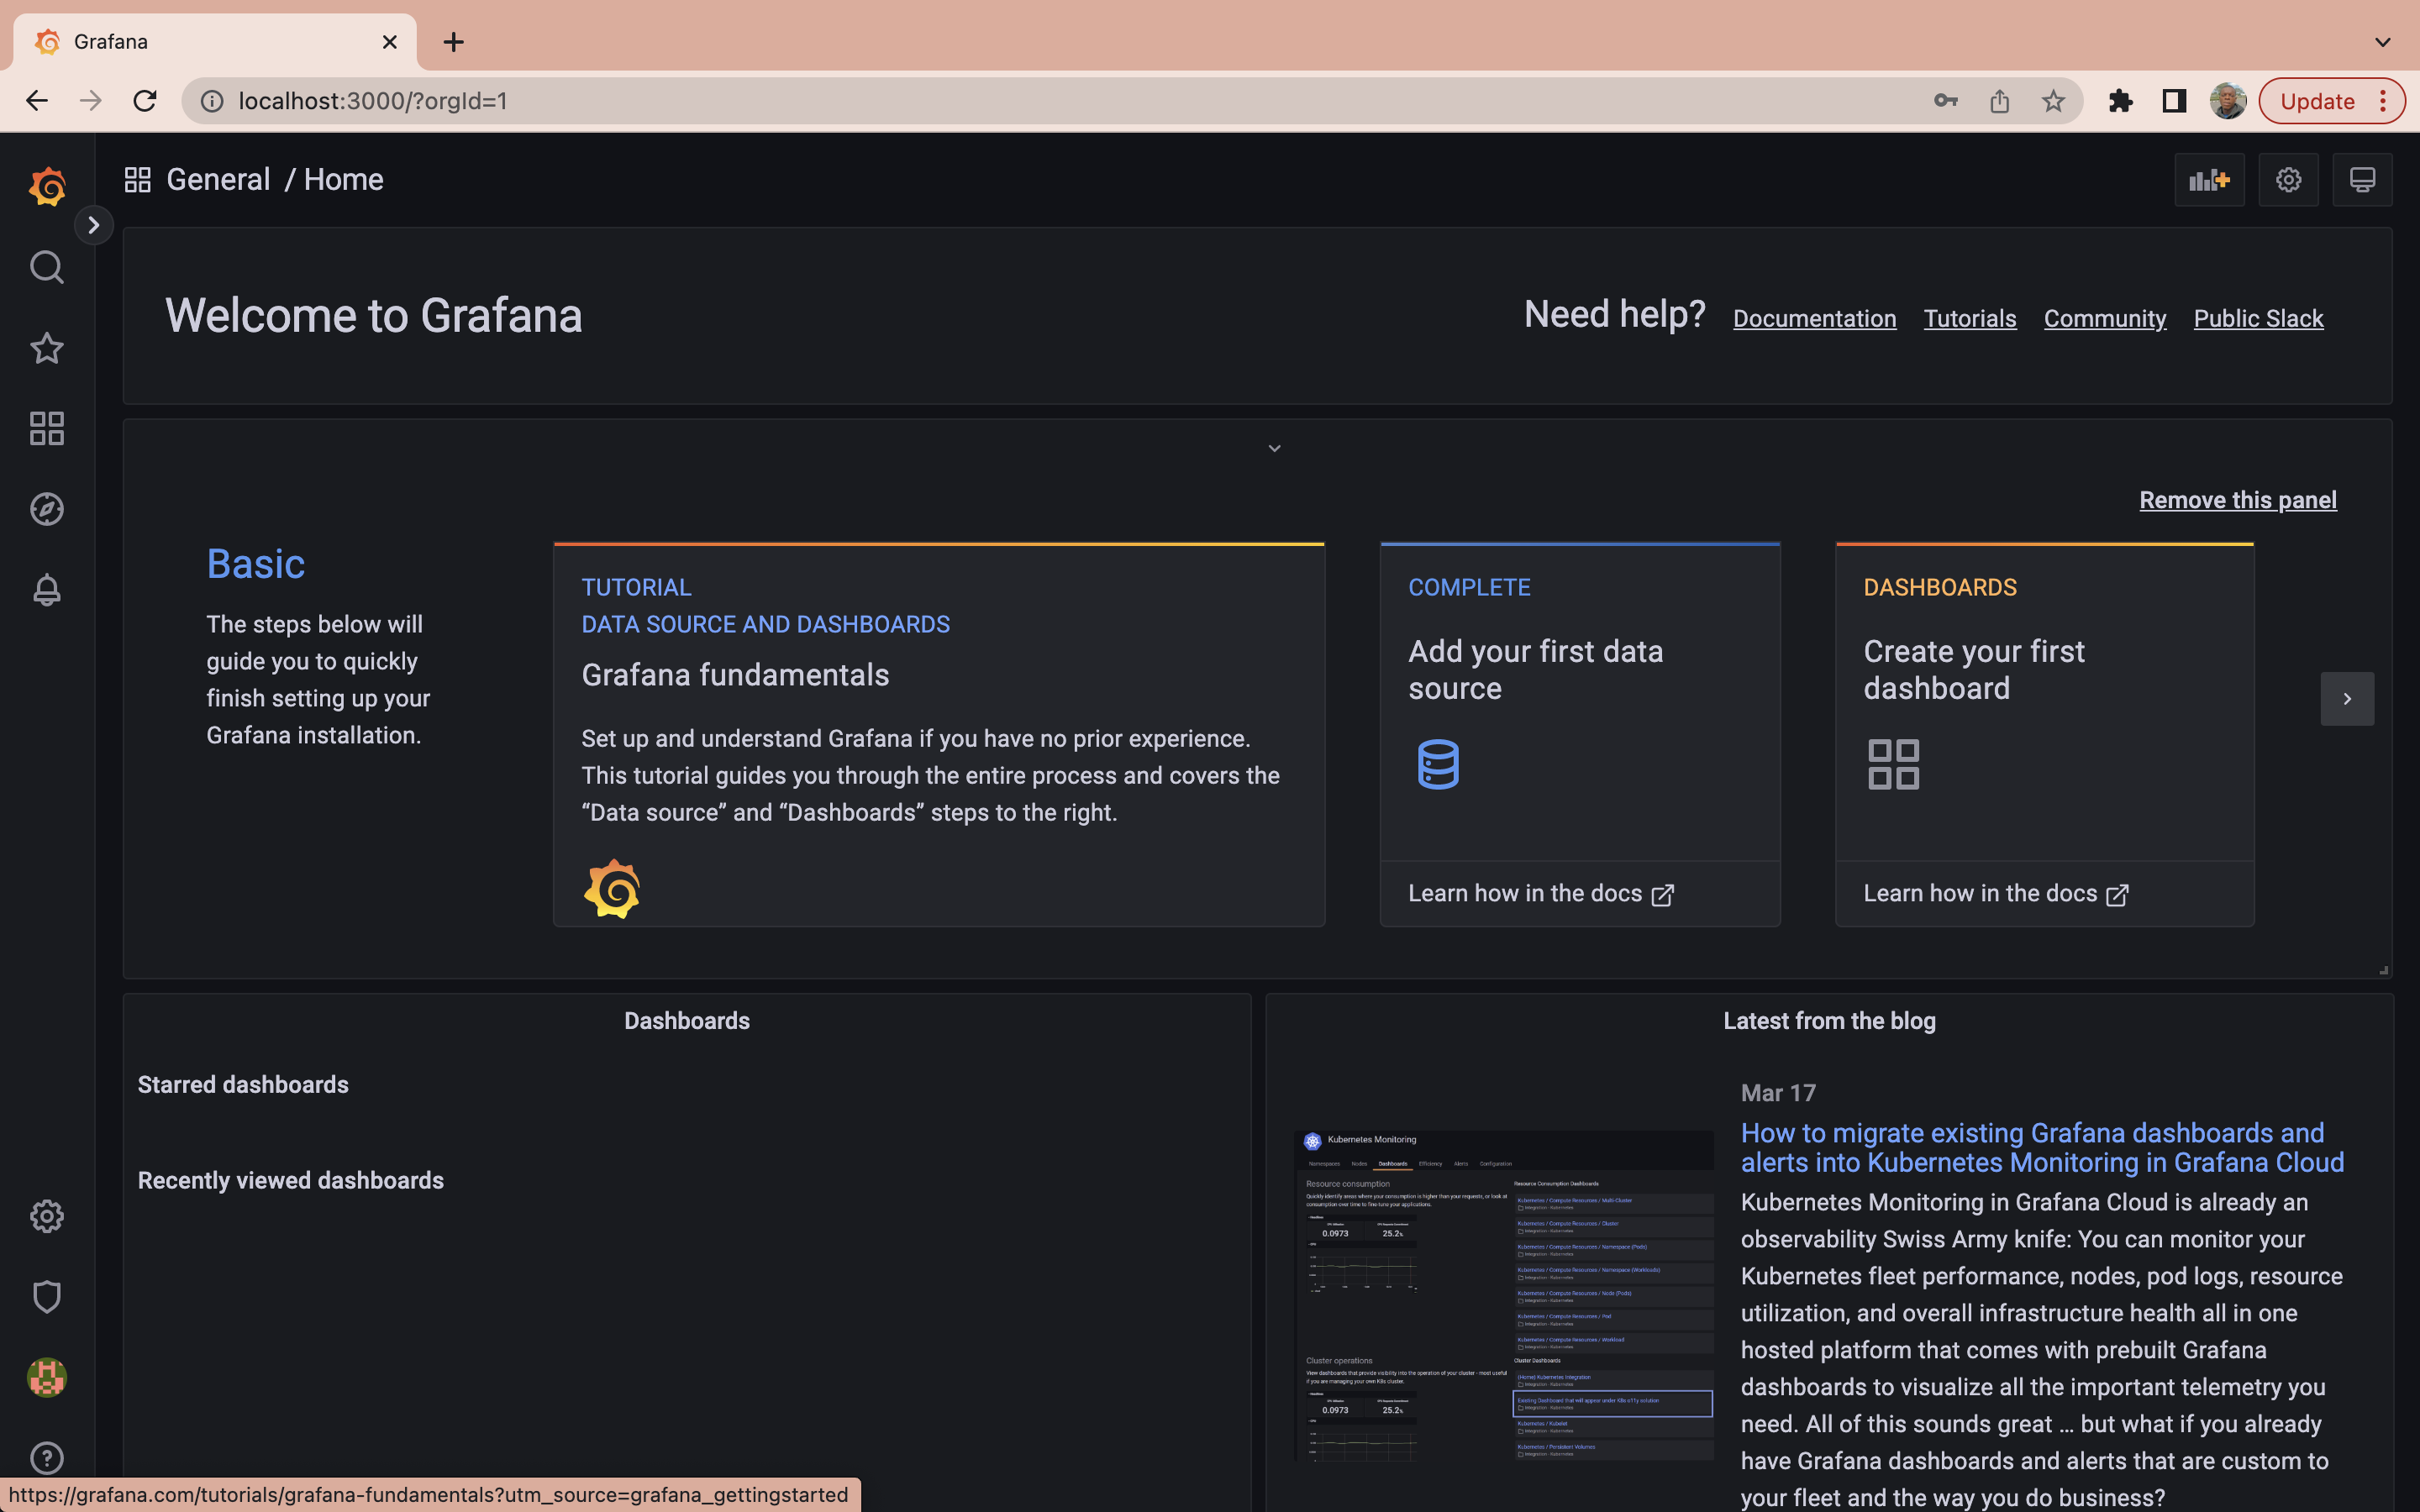
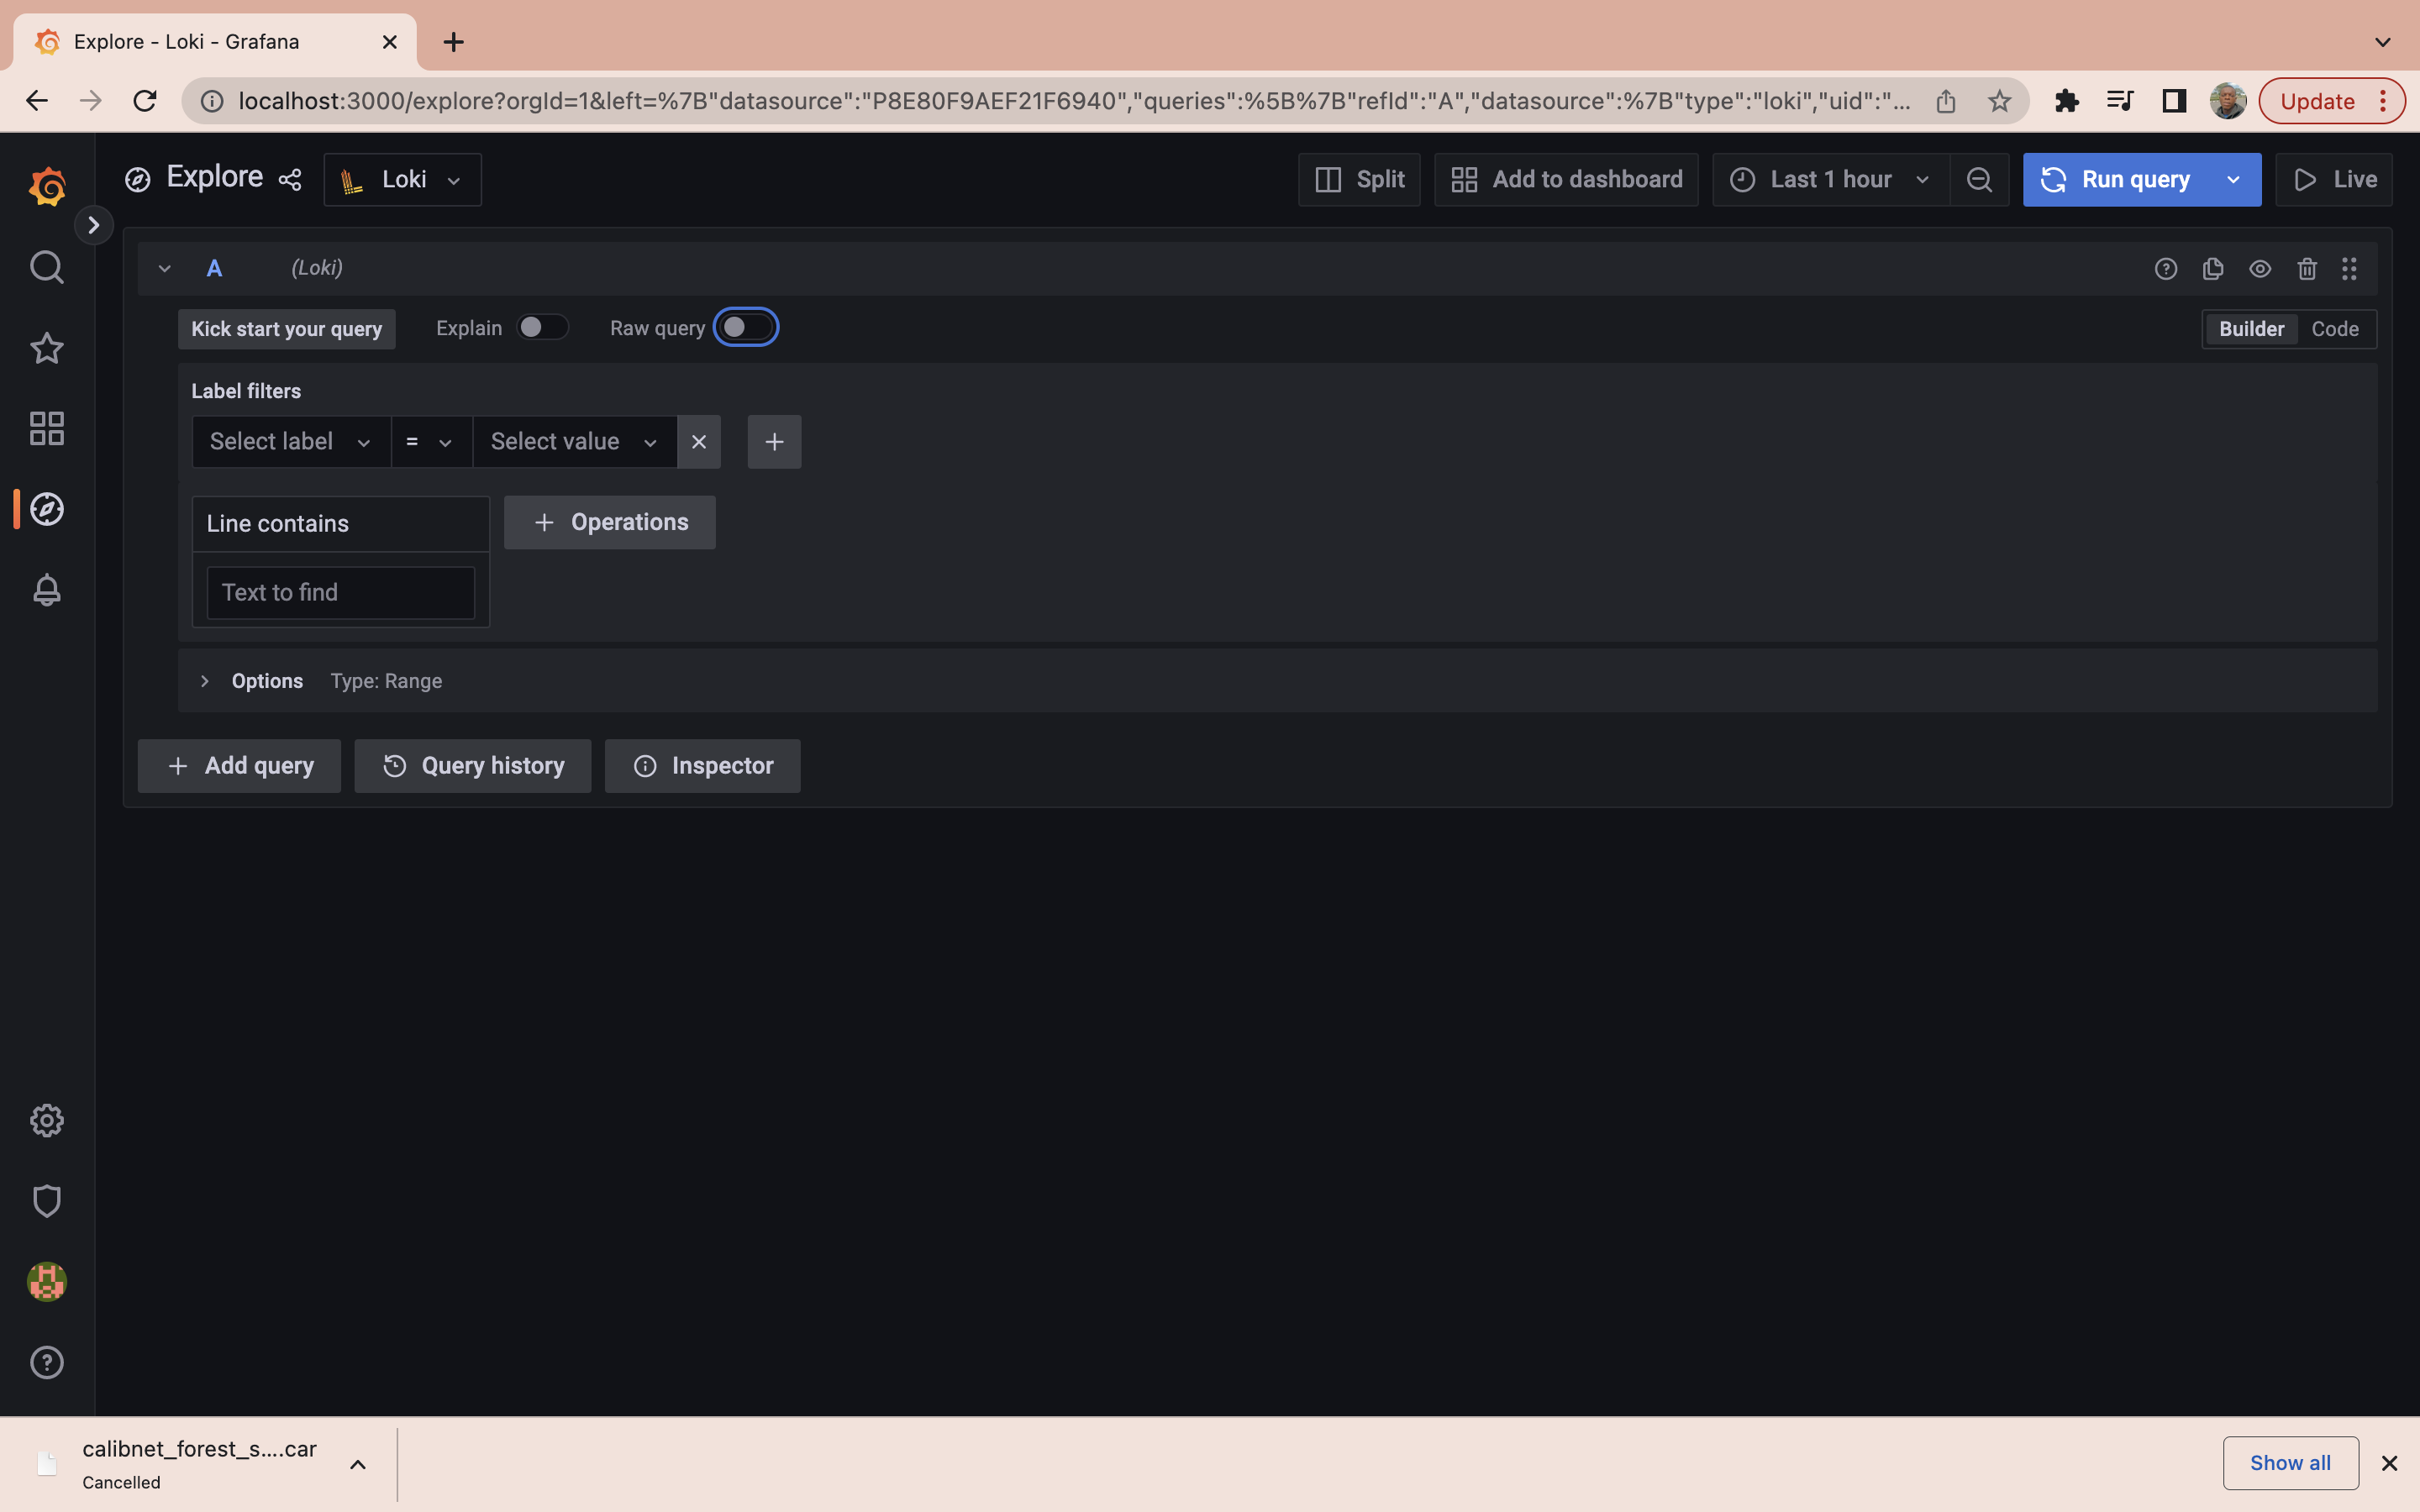
You have now gained access to the Grafana, Next step is to start querying the logs, navigate to http://localhost:3000/explore or http://YOUR_SERVER_IP:3000/explore if you’re using a cloud server.
LogQL Sample Queries
Now that you have installed Grafana and have access to it, the next step is to start running some LogQL sample queries. Firstly on the top right of the explore page click on the code button

Next, run the following query to fetch all log lines matching label filter namespace:
{namespace="logging"} |= ``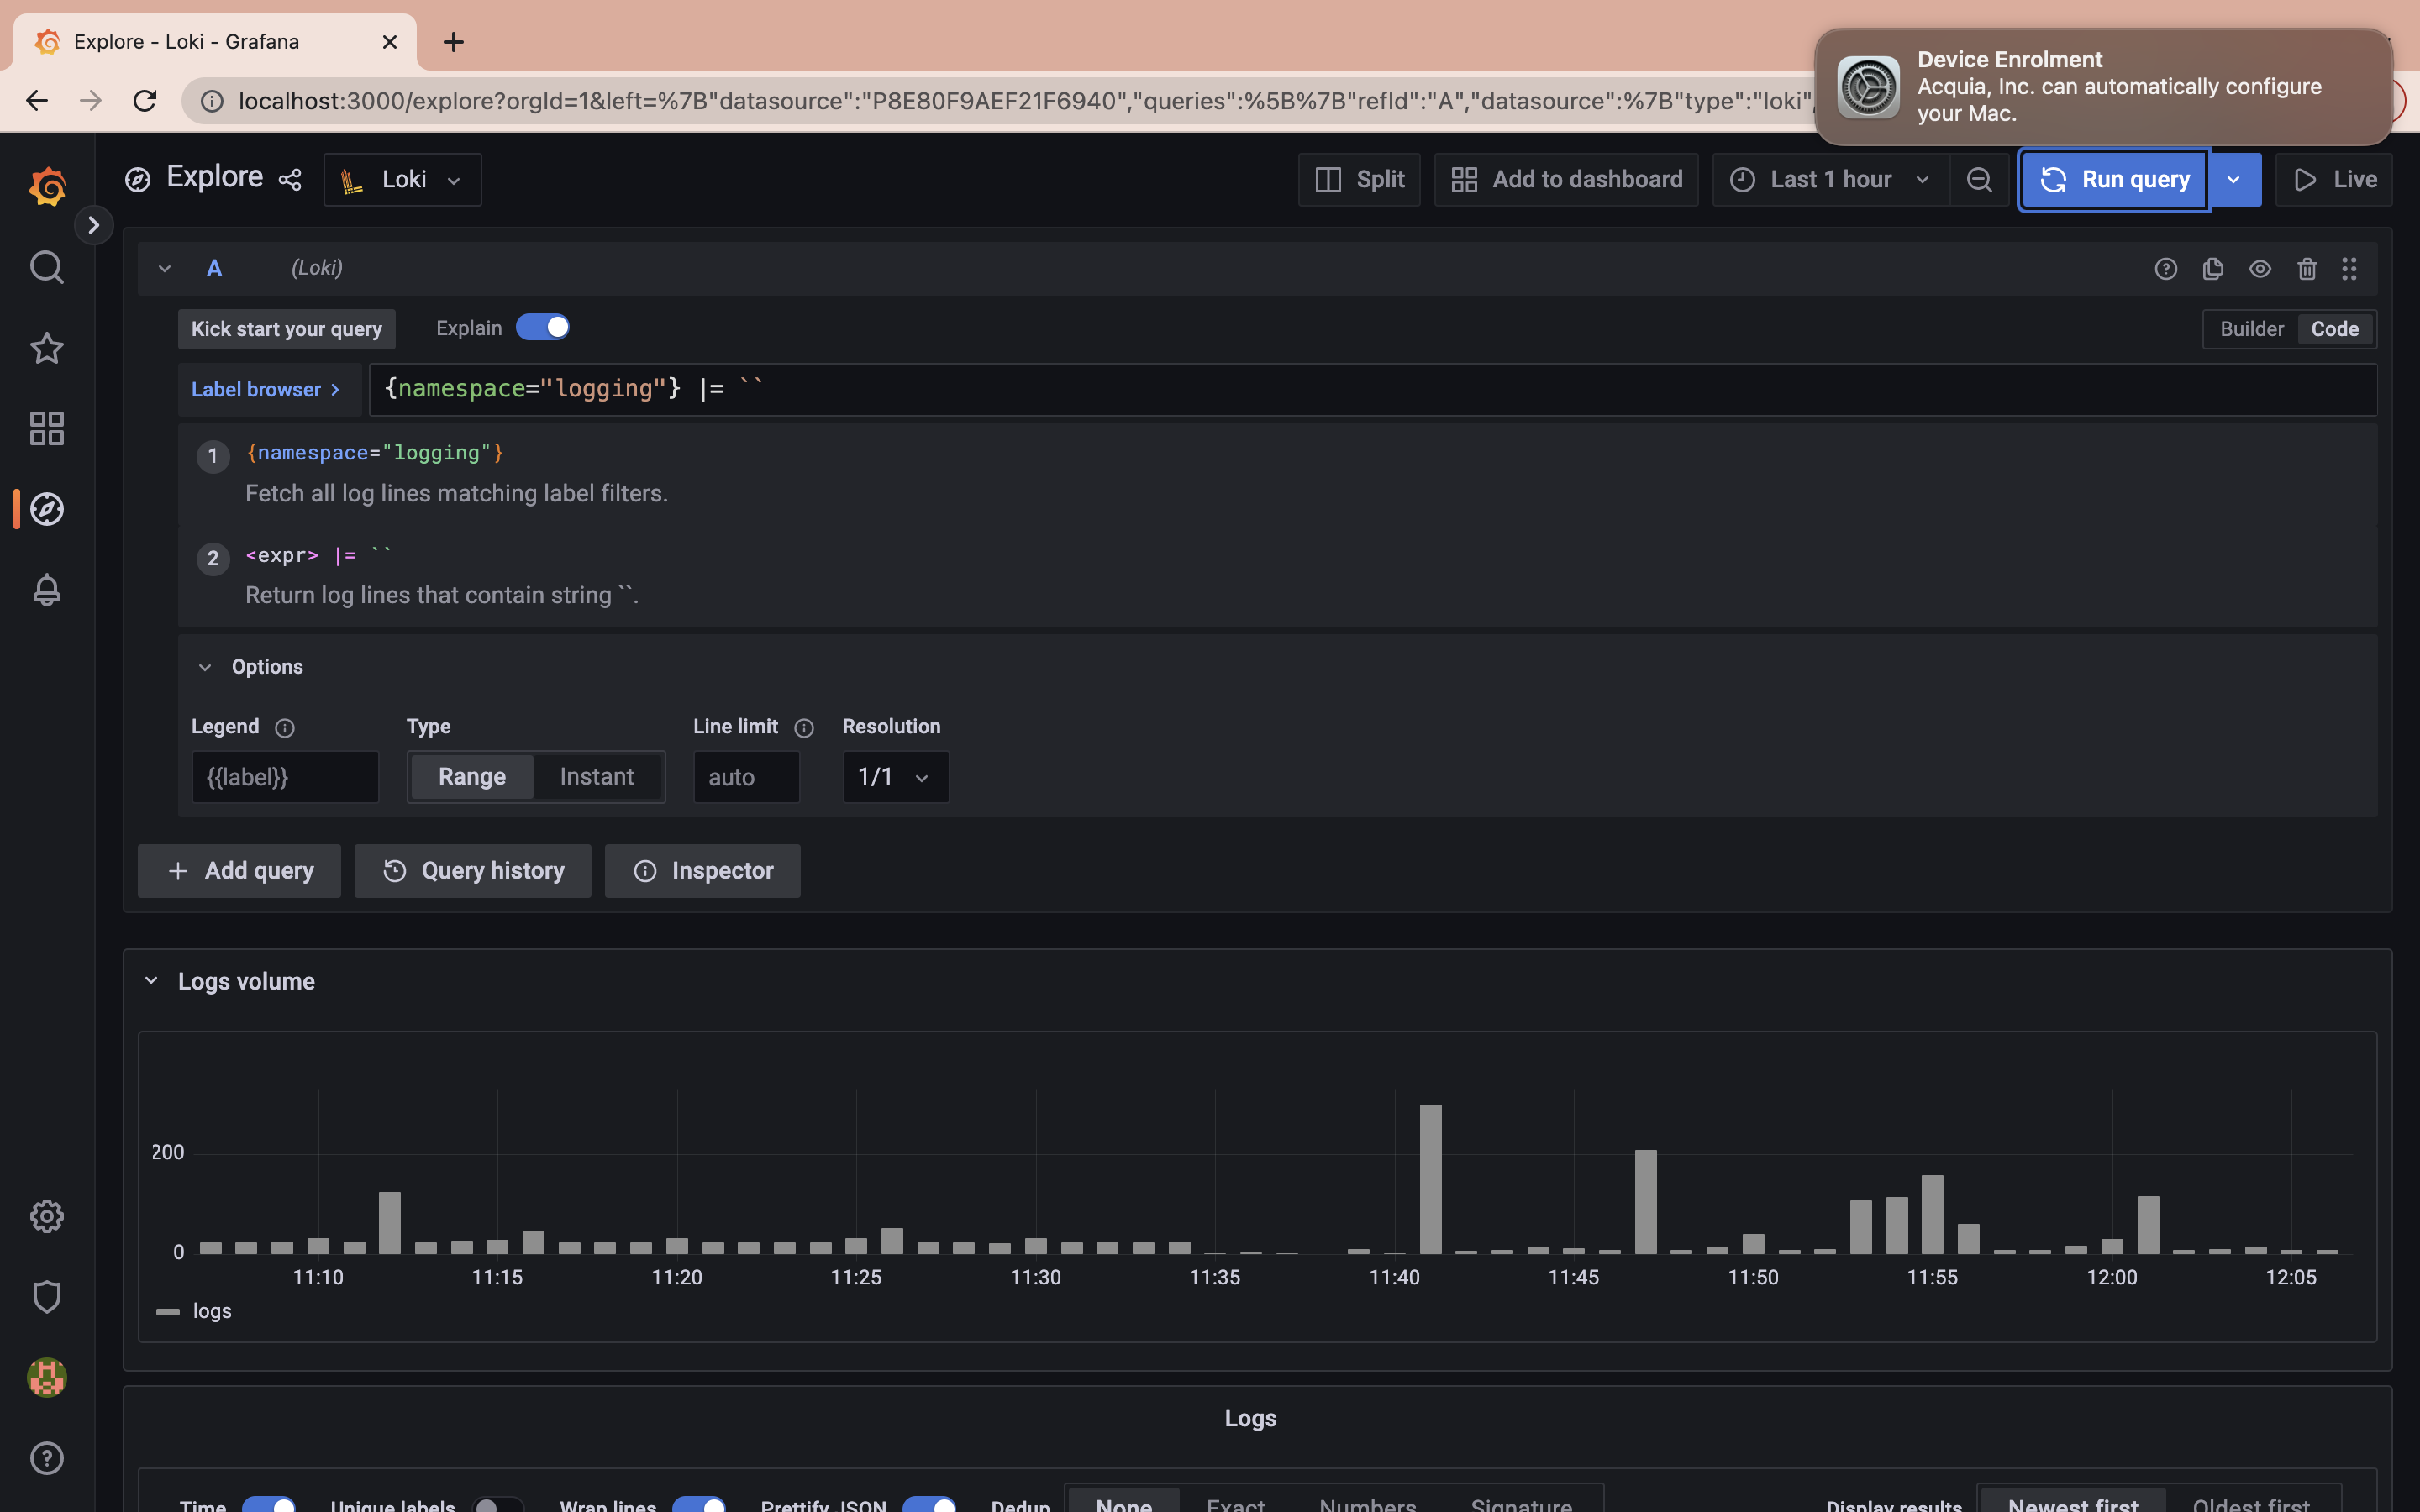
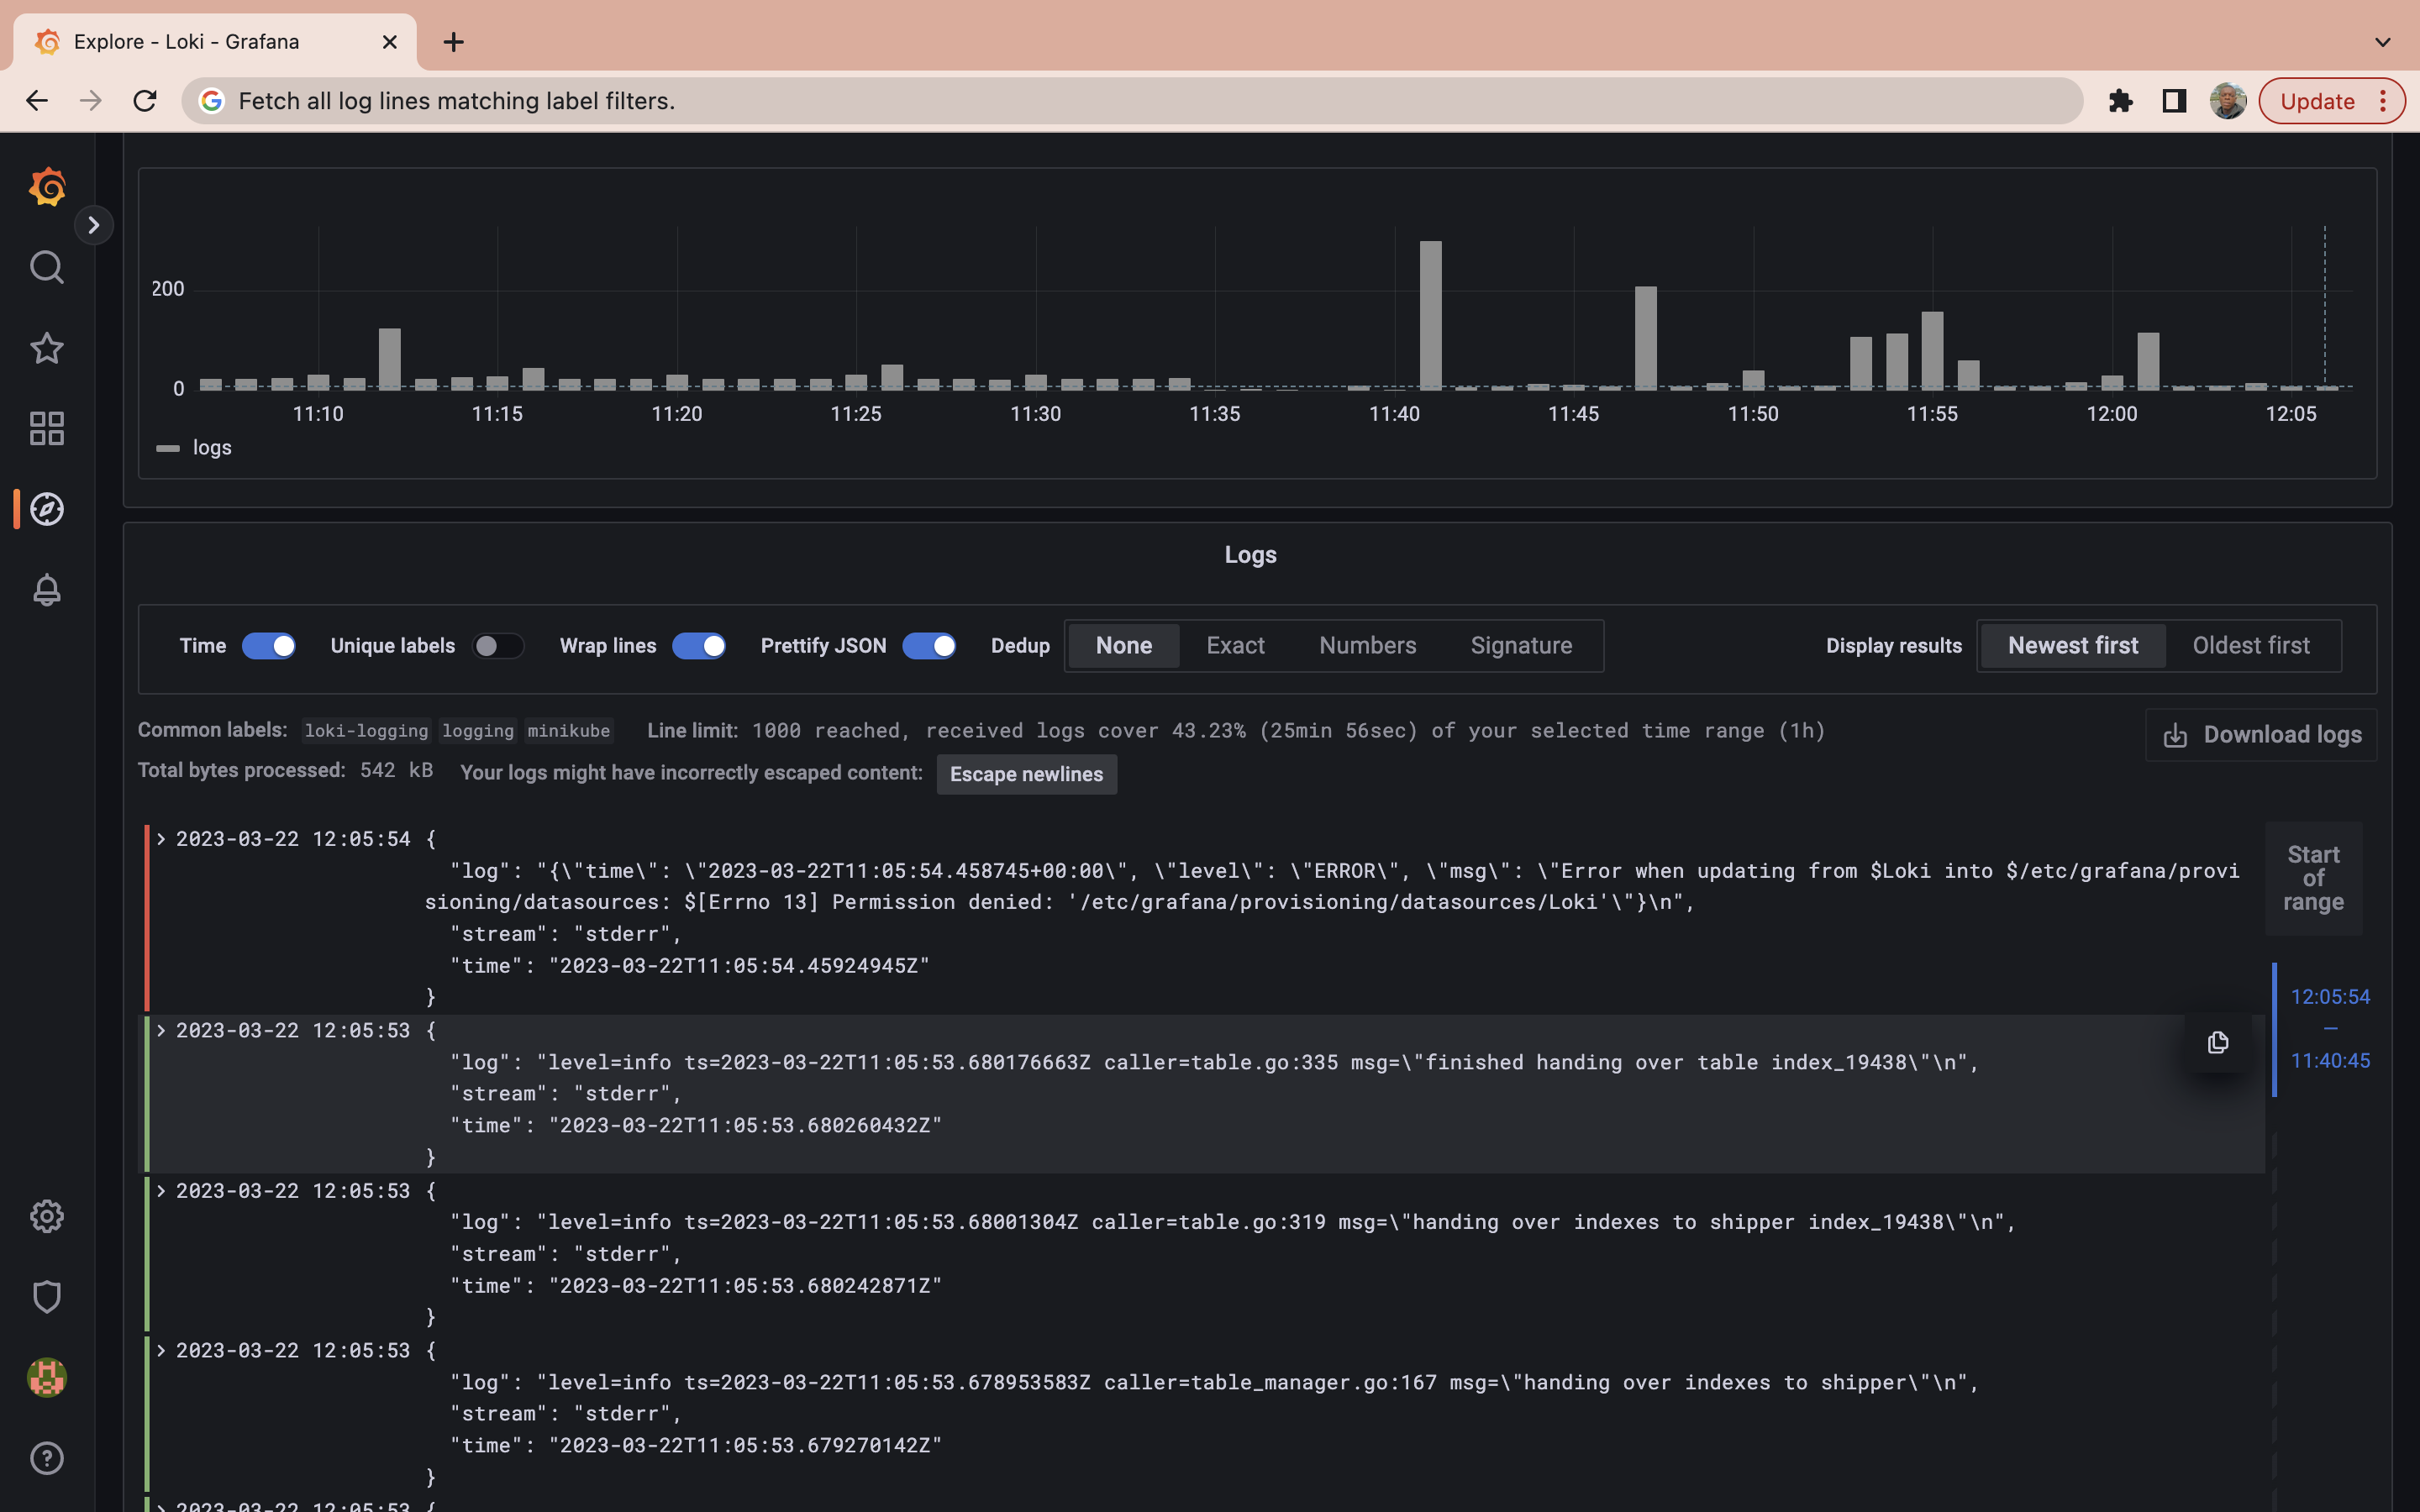
The query above shows you all the logs generated by the pods in the namespace logging.
It may not be concise to run a LogQL to retrieve all logs generated in a particular namespace when querying logs. The next step will be to run a query to obtain logs from all pods labeled etcd in the kube-system namespace. To do so run the following query:
{container="etcd",namespace="kube-system",}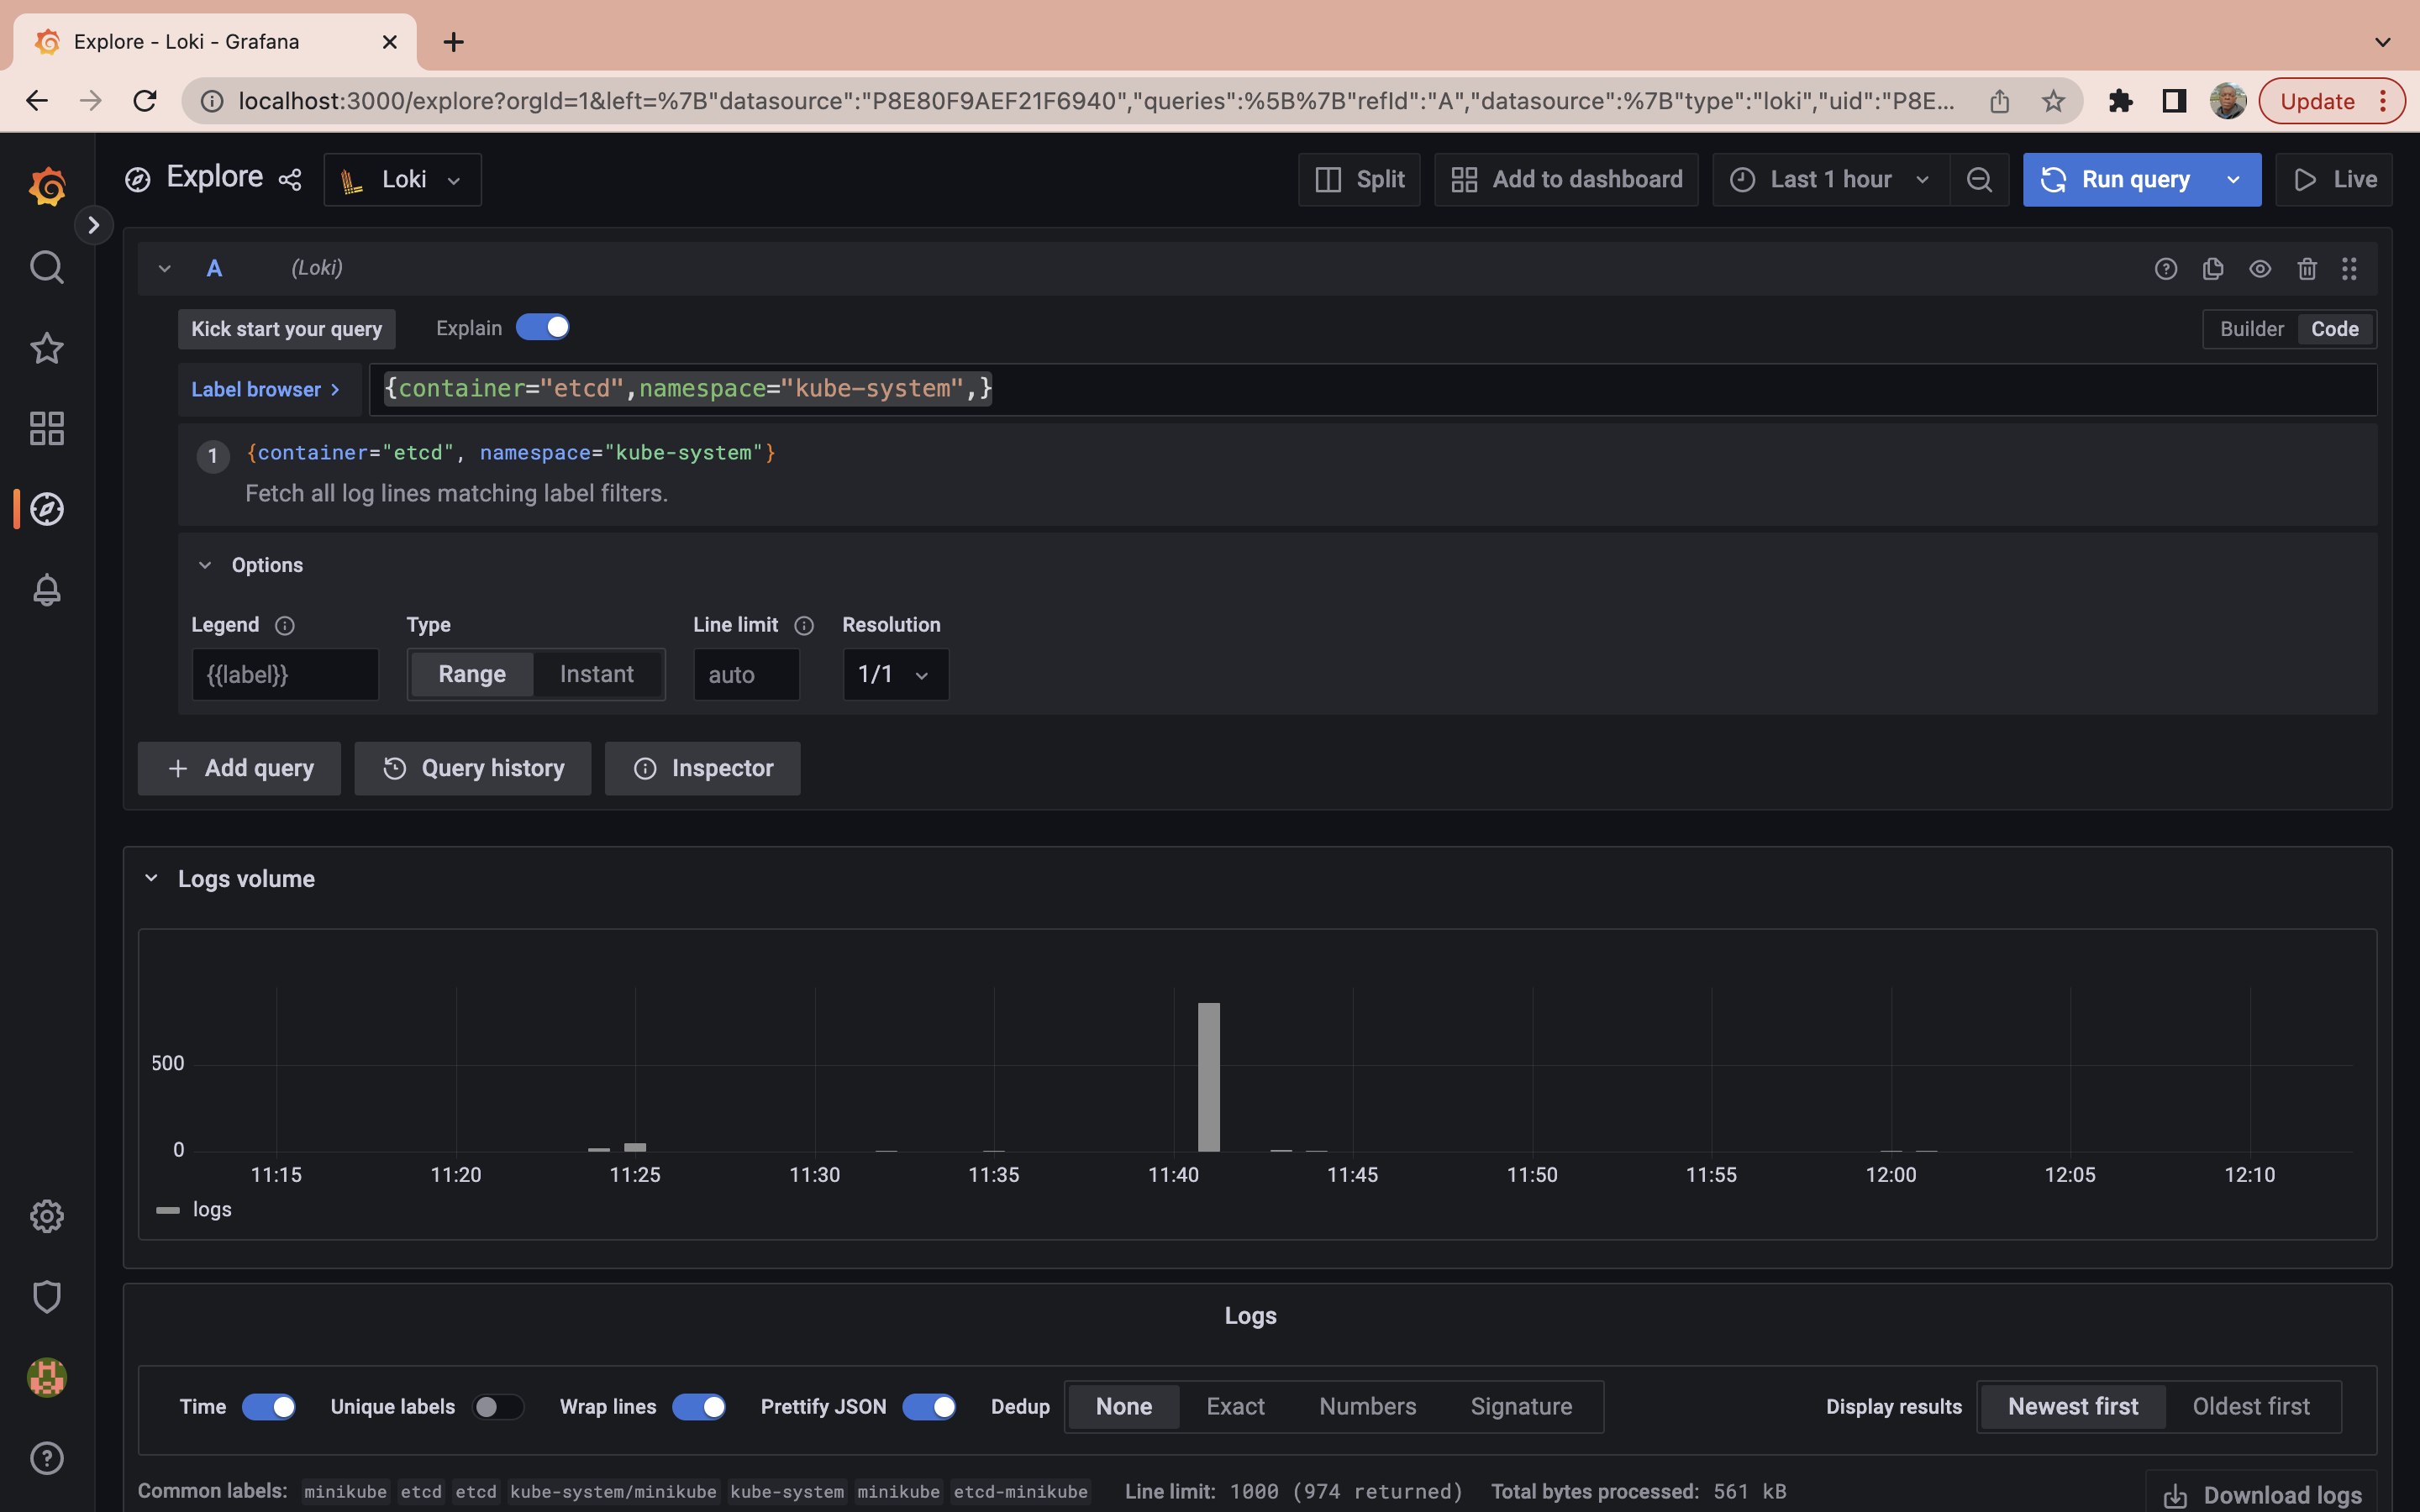
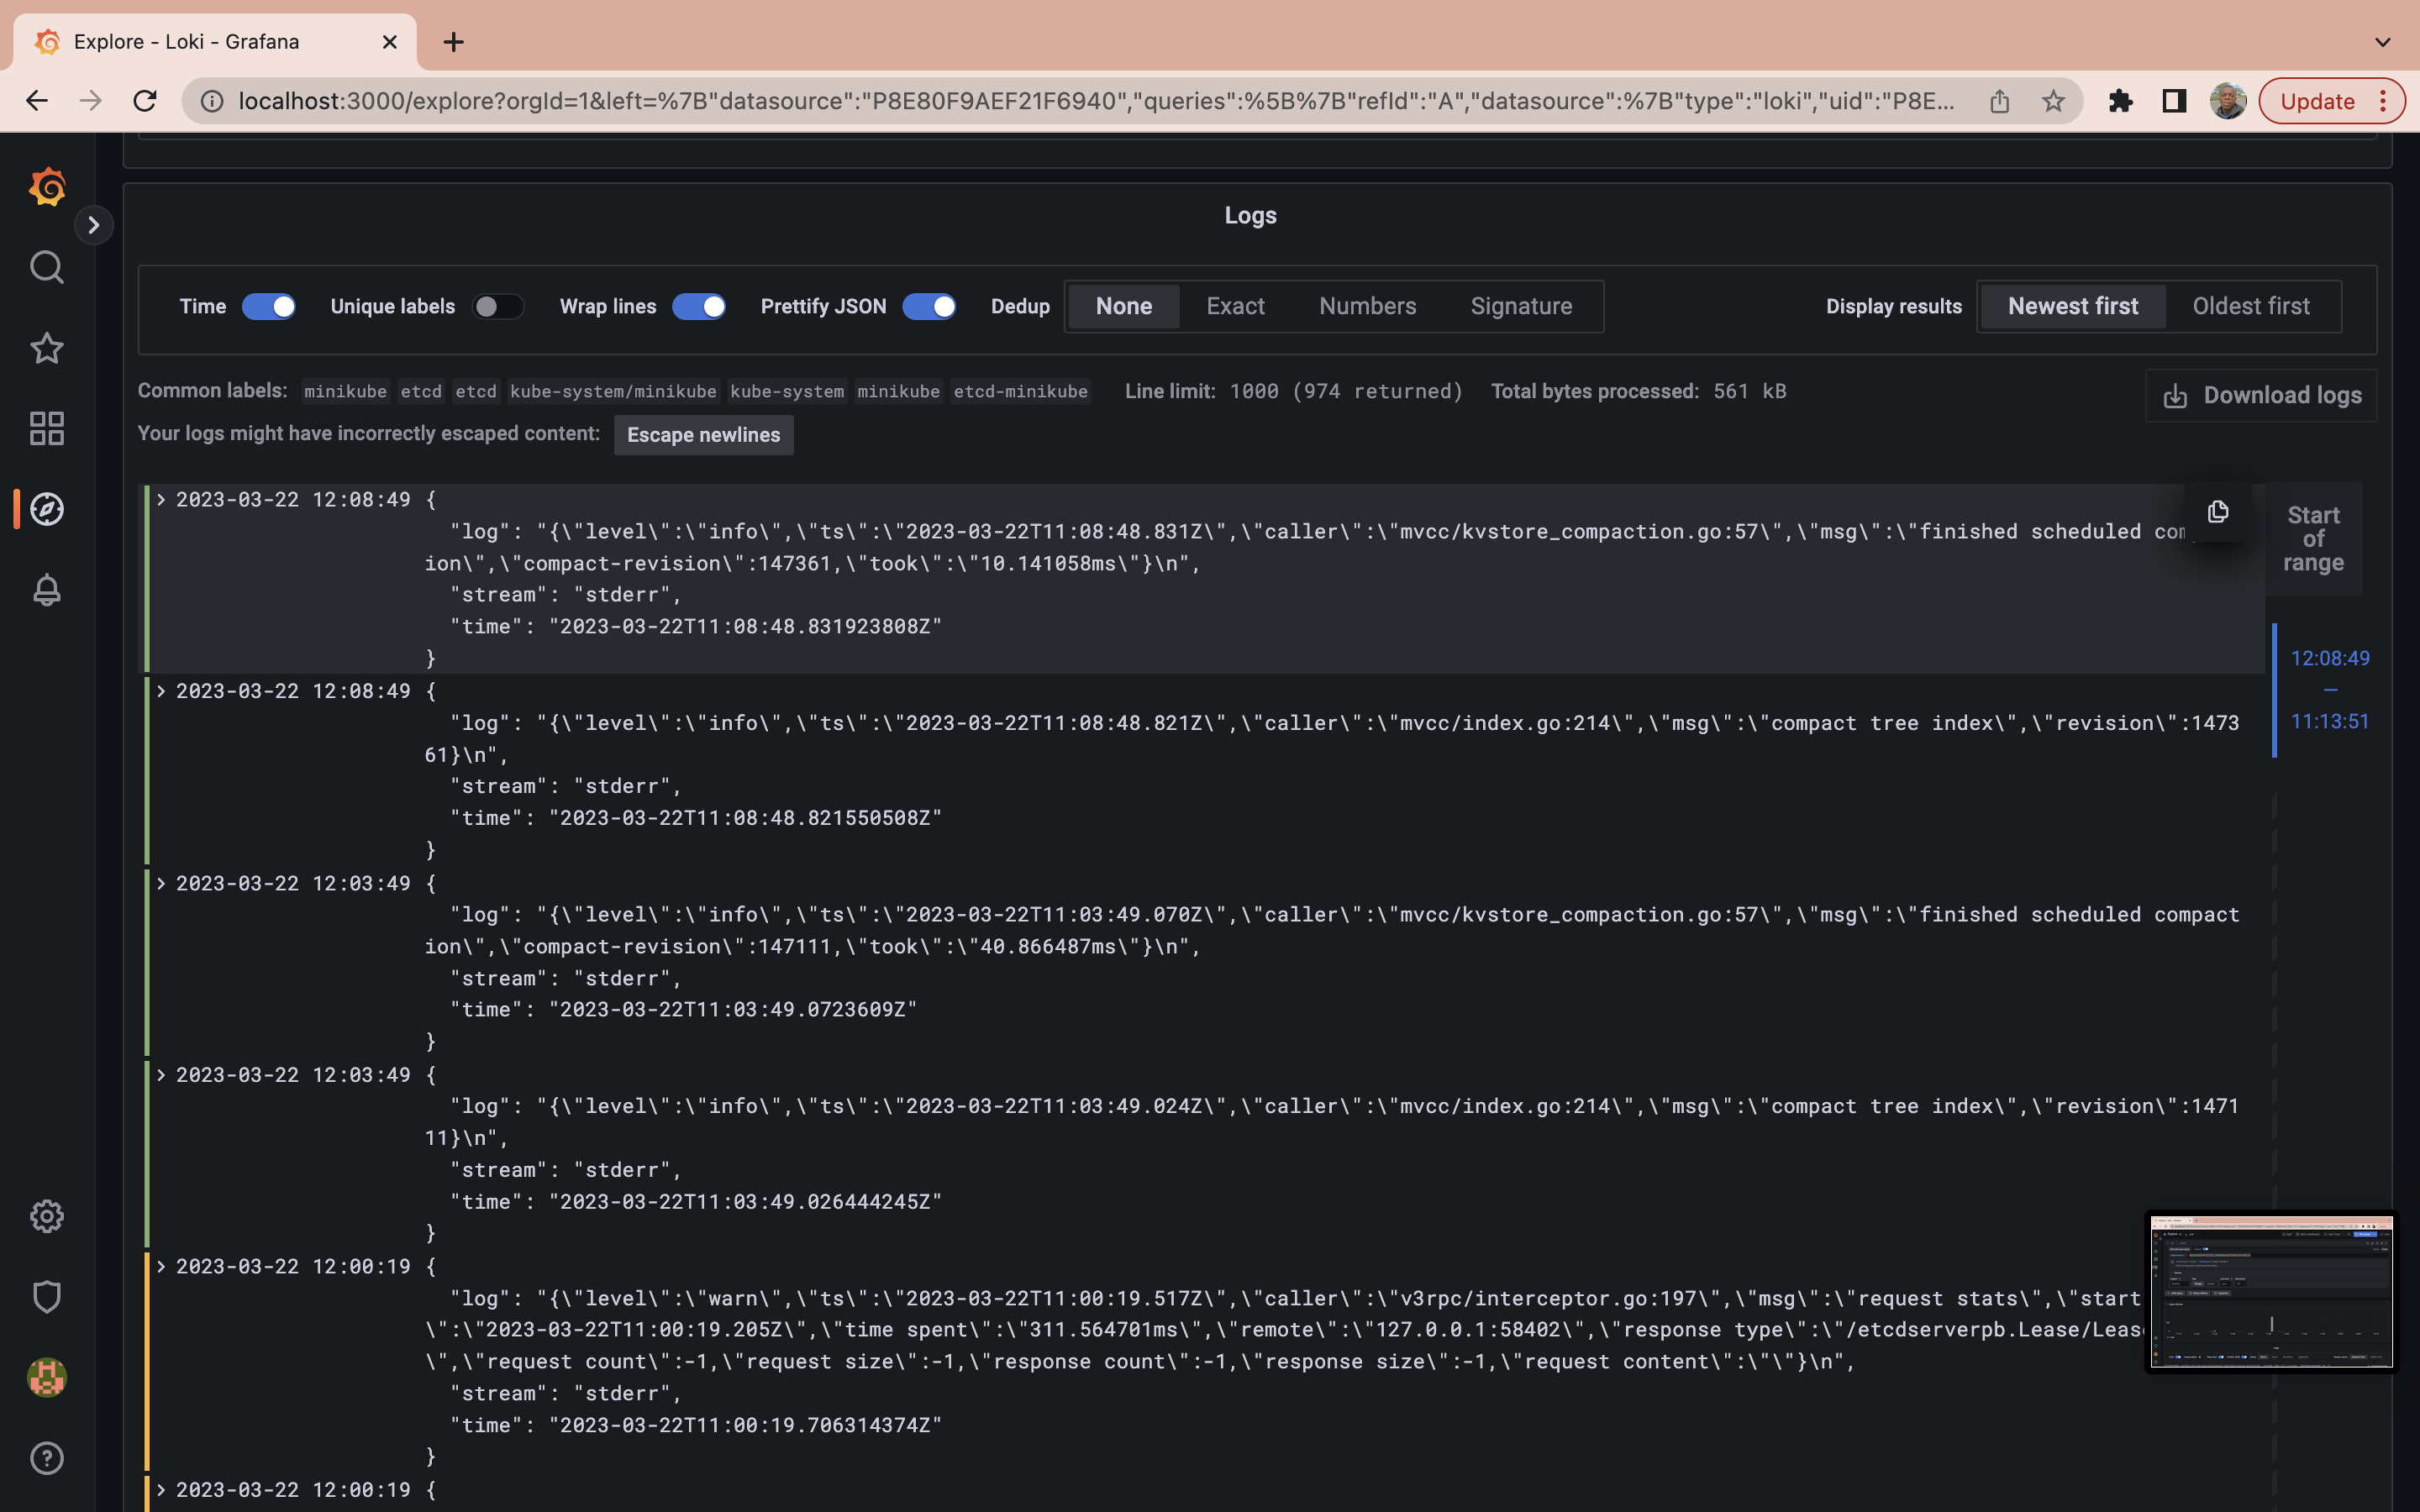
While the query process has become more efficient, sometimes you need to go even further. When searching through logs, you might want to refine your results beyond namespace and pod specifications. You may want to filter results based on specific log messages. In this case, you can use a query to retrieve logs from a particular container labeled etcd in the kube-system namespace but only display those logs that contain the word “error” in the message:
{container="etcd",namespace="kube-system"} |= "error"
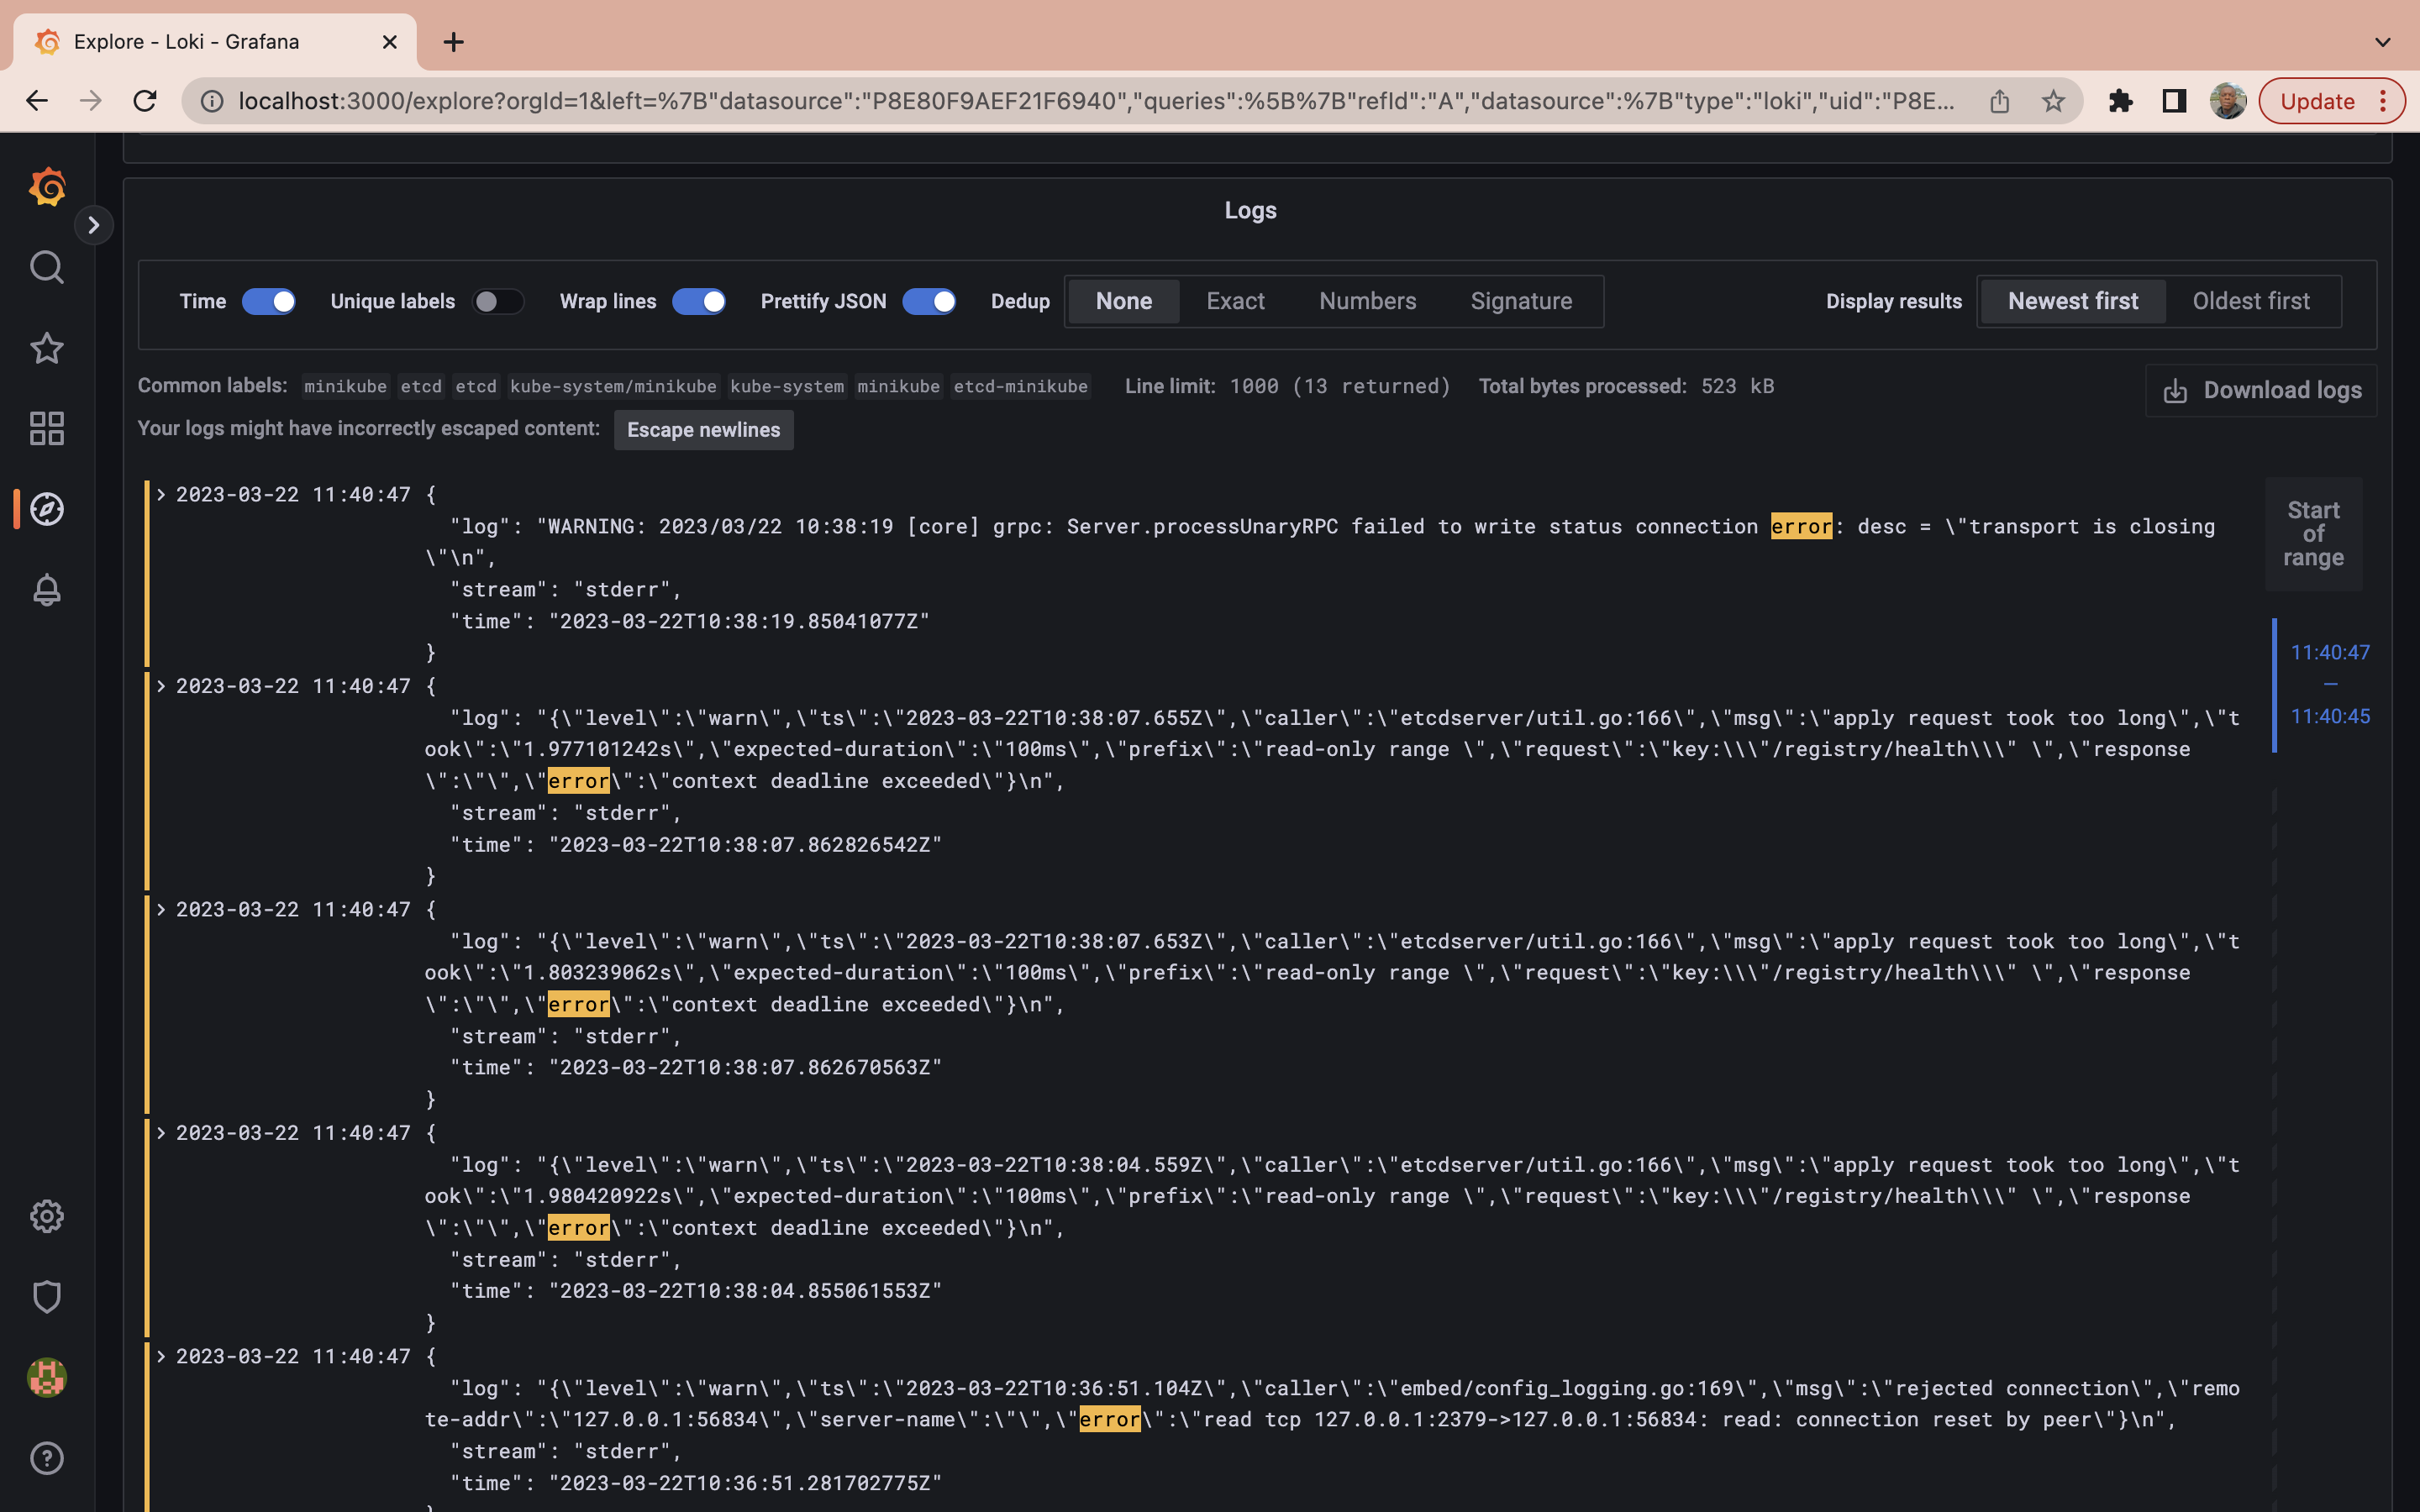
At this point you have already learned basic LogQL usage to get you started with Grafana Loki, to learn more about the LogQL you can check out the official documentation.
To sum up, you set up the Grafana Loki stacks to your Kubernetes cluster, you also ran some basic LogQL queries to query through logs generated by the pods in your Kubernetes cluster.
Conclusion
Grafana Loki is a robust log aggregation system that collects, stores, and queries log data in a cost-effective manner. Its distributed architecture and potent query language make it an ideal tool for businesses of all sizes aiming to optimize operations, enhance security, and make data-driven decisions.
While you’re optimizing your operations, you might also want to boost your build processes. If so, give Earthly a try! It’s a valuable addition to any toolkit, just like Grafana Loki.
Earthly makes CI/CD super simple
Fast, repeatable CI/CD with an instantly familiar syntax – like Dockerfile and Makefile had a baby.


