Grafana & Prometheus Kubernetes Cluster Monitoring
We’re Earthly. We simplify software building using containerization. Earthly can streamline your Kubernetes container building process. Check it out.
So you have a Kubernetes cluster, and you want to keep an eye on its memory CPU and storage usage? Well, look no further than Grafana and Prometheus monitoring.
Grafana and Prometheus Kubernetes Cluster Monitoring reports on potential performance bottlenecks, cluster health, and performance metrics. Simultaneously, visualize network usage, pod resource usage patterns, and a high-level overview of what’s going on in your cluster.
In this guide, you’ll learn how to monitor your Kubernetes cluster, viewing internal state metrics with Prometheus and the Grafana dashboard.
How to Monitor the Kubernetes Cluster using Prometheus and Grafana Dashboards
You’re going to create your own monitoring dashboard for your Kubernetes cluster. You’ll be using [Prometheus] (https://prometheus.io//) to handle the extraction, transformation, and loading of all your assets from the Kubernetes cluster. Grafana, which will be used for querying, visualizing, monitoring, and notifying.
Prerequisites
This guide will be a step-by-step tutorial. To follow along, be sure to have the following:
Docker: To install Docker on your local machine, follow the download instructions.
Kubectl: To install Kubectl on your local machine, follow the download instructions.
Helm: To install Helm on your local machine, follow the [download instructions] (https://helm.sh/docs/intro/install/). It will be used for deploying the Prometheus operator.
Kubernetes cluster: To install Kubernetes on your local machine, follow the download instructions.

Create Namespace and Add Helm Charts Repo
The first step is to create a namespace in the Kubernetes cluster. It will establish a separate place in your Kubernetes cluster for the Prometheus and Grafana servers to be deployed into. To do so, run the following commands on the command line.
Kubectl create namespace Kubernetes-monitoring After you have run the above commands, you need to add the Prometheus-community helm repo and also update the repo. To do so, run the following commands.
# Add Prometheus-community repo
helm repo add Prometheus-community \
https://prometheus-community.github.io/helm-charts

# To update the helm repo
 Helm update repo
Deploying Helm Charts to Created Namespace
Run the helm install command below after adding the Helm repo to deploy the kube-prometheus stack Helm chart. Replace monitoring with the name of your choice.
By acting on a set of Custom Resource Definitions(CRDs), this Helm chart configures a comprehensive Prometheus Kubernetes monitoring stack. To deploy the chart to the Kubernetes cluster, run the following commands.
helm install monitoring prometheus-community/Kube-prometheus-stack \
 --namespace Kubernetes-monitoring
run the following command to confirm your Kube-Prometheus stack deployment.
kubectl get pods -n Kubernetes-monitoring
Accessing the Prometheus Instance and Viewing the Internal State Metrics
After you’ve successfully deployed your Prometheus and Grafana instances to your Kubernetes cluster, the next step is to use them to monitor the cluster. To do this, we must enable traffic to the Prometheus pod to observe your cluster’s internal metrics. This will also enable you to access the Prometheus server from your browser. Run the following command to obtain the name of the Prometheus server to which you will be forwarding traffic to.
kubectl get svc -n Kubernetes-monitoring
Next, run the below kubectl port-forward command to forward the local port 9090 to your cluster via the Prometheus service (svc/monitoring-kube-prometheus-prometheus). To do so run the following commands.
kubectl port-forward svc/monitoring-kube-prometheus-prometheus \
-n monitoring 9090
Open a web browser, and navigate to either of the URLs below to access your Prometheus instance.
Navigate to http://localhost:9090 if you’re following along with local windows, Linux or mac machine. Navigate to your server’s IP address followed by port 9090 (i.e., http://YOUR_SERVER_IP:9090) if you’re using a cloud server.
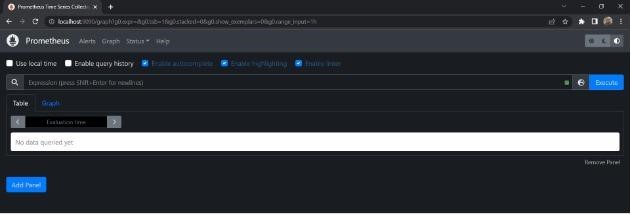
To exit from the port forward session press ctrl c or command c The next thing is to view internal state metrics for the Prometheus kubernetes cluster and the kube-state-metrics (KMS) tool deployed with the helm chart stacks used. The Kube-state-metrics (KSM) tool allows you to view your Kubernetes cluster’s internal state metrics. The KSM tool allows you to monitor the health and consumption of your resources, as well as internal state objects. KSM can potentially display data points such as node metrics, deployment metrics, and pod metrics. The KSM tool is pre-packaged in the kube-prometheus stack and is immediately installed alongside the other monitoring components.
You’ll port-forward a local port to your cluster via the kube-state-metrics service. Doing so lets KSM scrape the internal system metrics of your cluster and output a list of queries and values.
To do so, run the following commands
# to check if the KMS Tools is running
kubectl get svc -n kubernetes-monitoring | grep kube-state-metrics

kubectl port-forward svc/monitoring-kube-state-metrics -n monitoring 8080
Open your browser and type http://localhost:8080 or if you’re using a cloud machine http://YOUR_SERVER_IP:8080). Please keep in mind that if you get a permissions access issue when forwarding traffic to port 8080, you can use this option.
kubectl port-forward svc/prometheus-kube-state-metrics -n \
monitoring 8085:80 
Click on the metric and to view the metrics
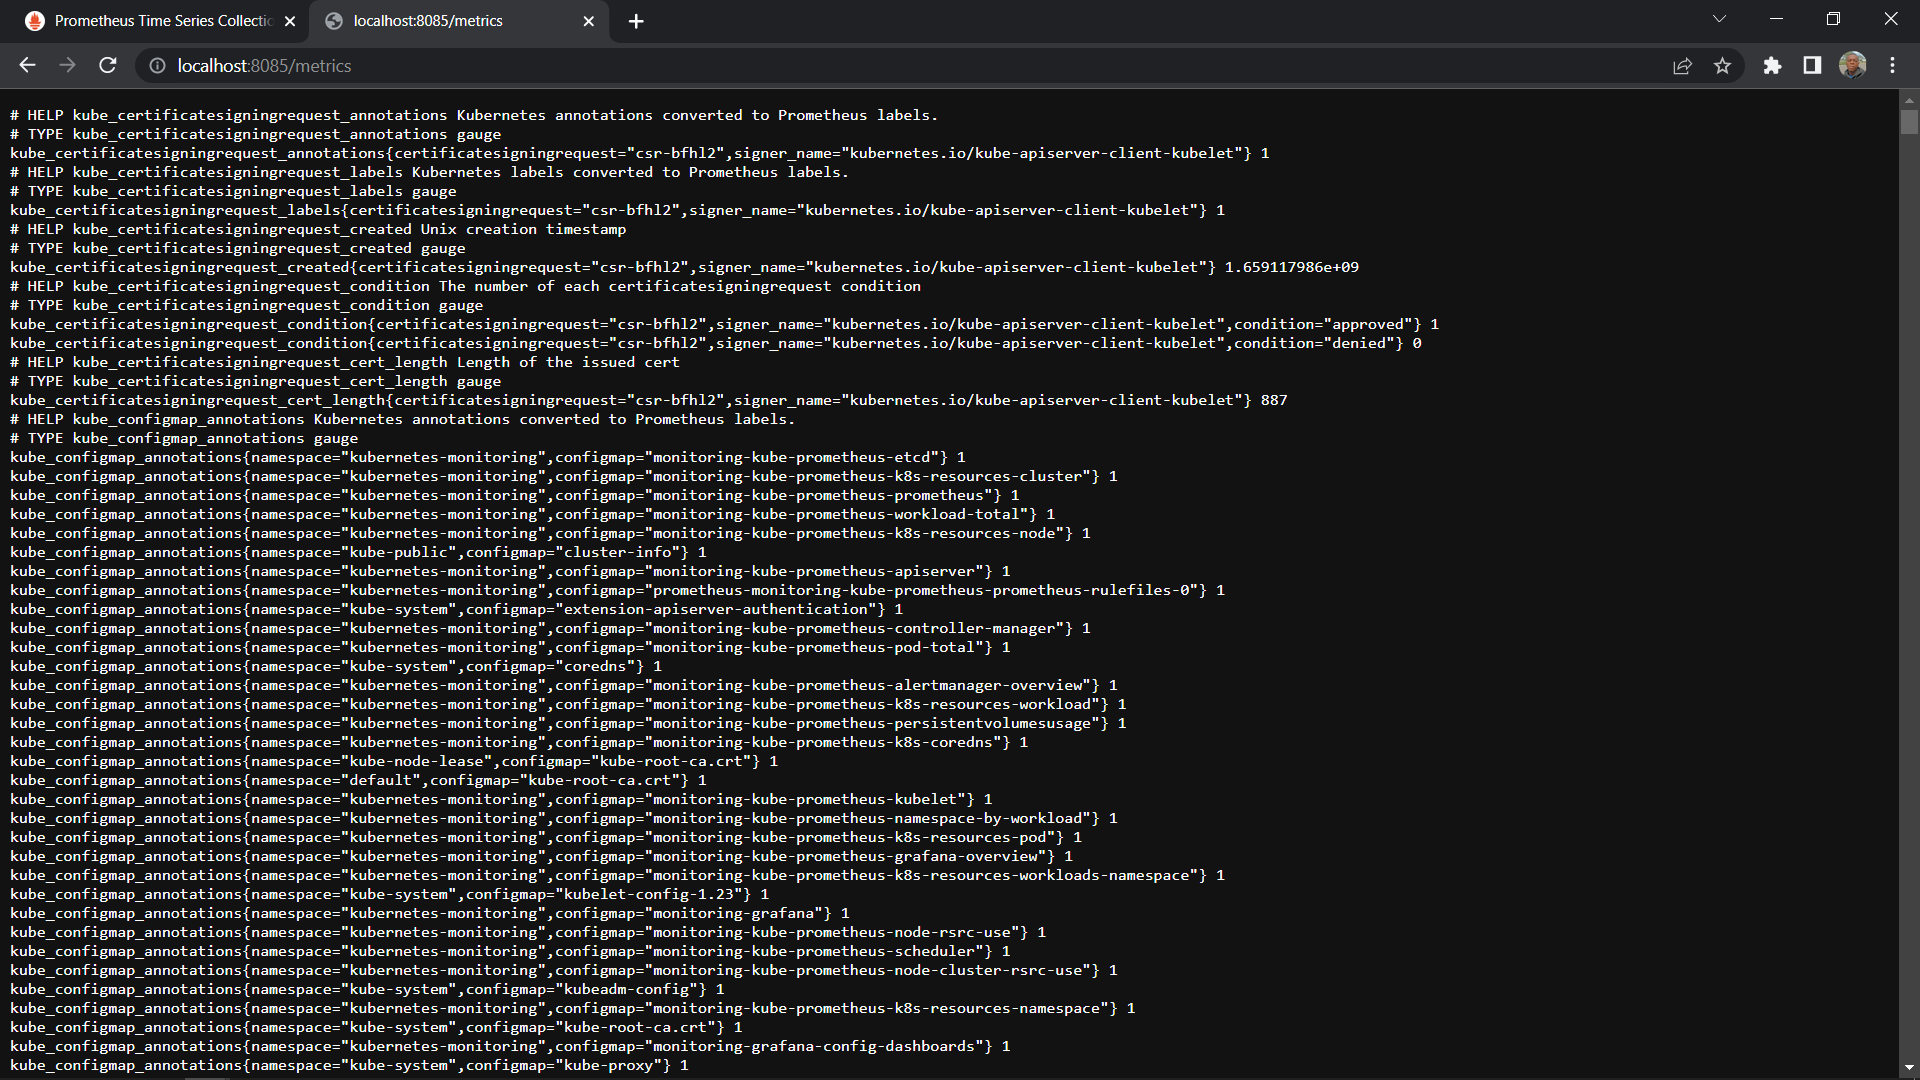
Visualizing a Cluster’s Internal State Metric on Prometheus
Now we will execute some Prometheus queries to see the internal state metrics of our kubernetes cluster. We will focus on CPU Utilization. [Check The Prometheus site] (prometheus.io/docs/prometheus/latest/querying/basics/) for more on the Prometheus query language.
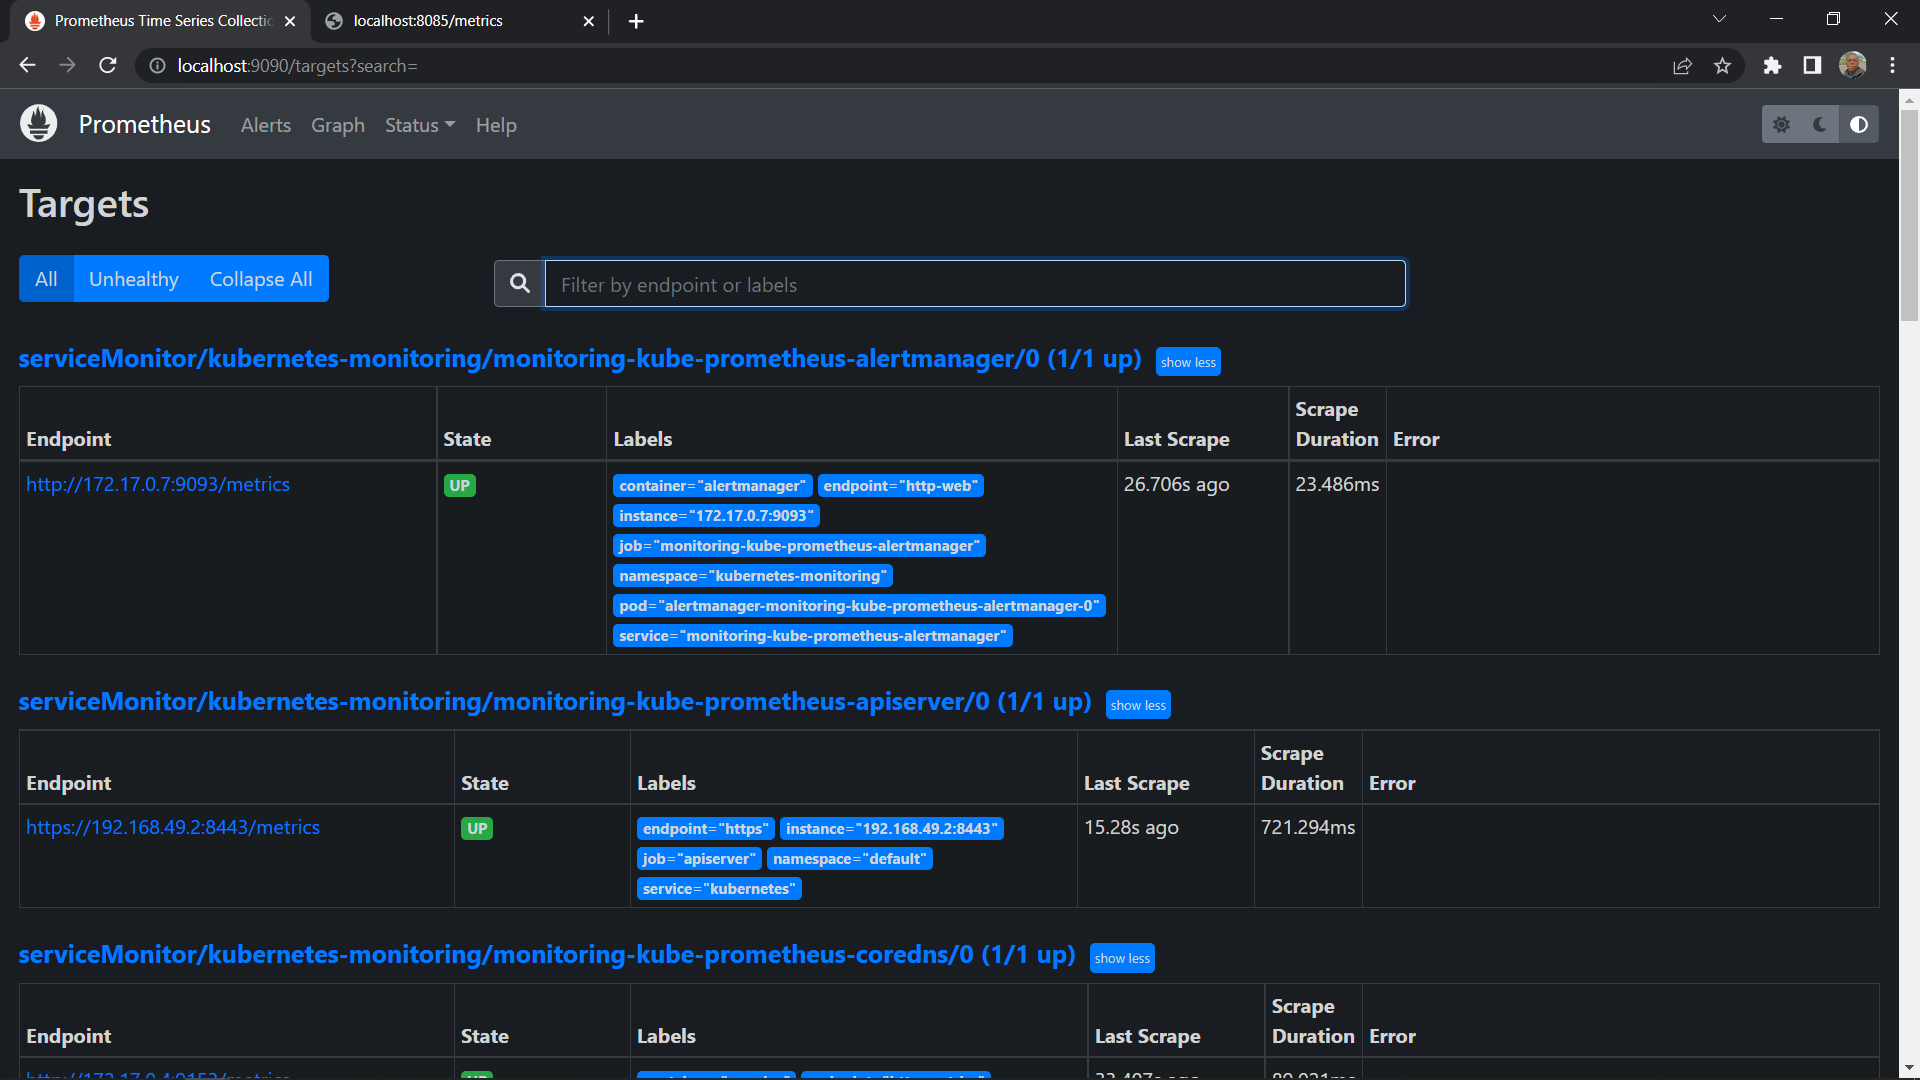
As seen above, many Kubernetes internal and monitoring components are set as Prometheus targets on http://localhost:9090/targets or http://YOUR_SERVER_IP:9090/targets.
Now, click on the graph icon in the top bar, enter the following commands in the search box to run the query, and then click on the graph bar below the search bar.
Sum by (cpu)(m=node_cpu_seconds_total{mode!="idle"})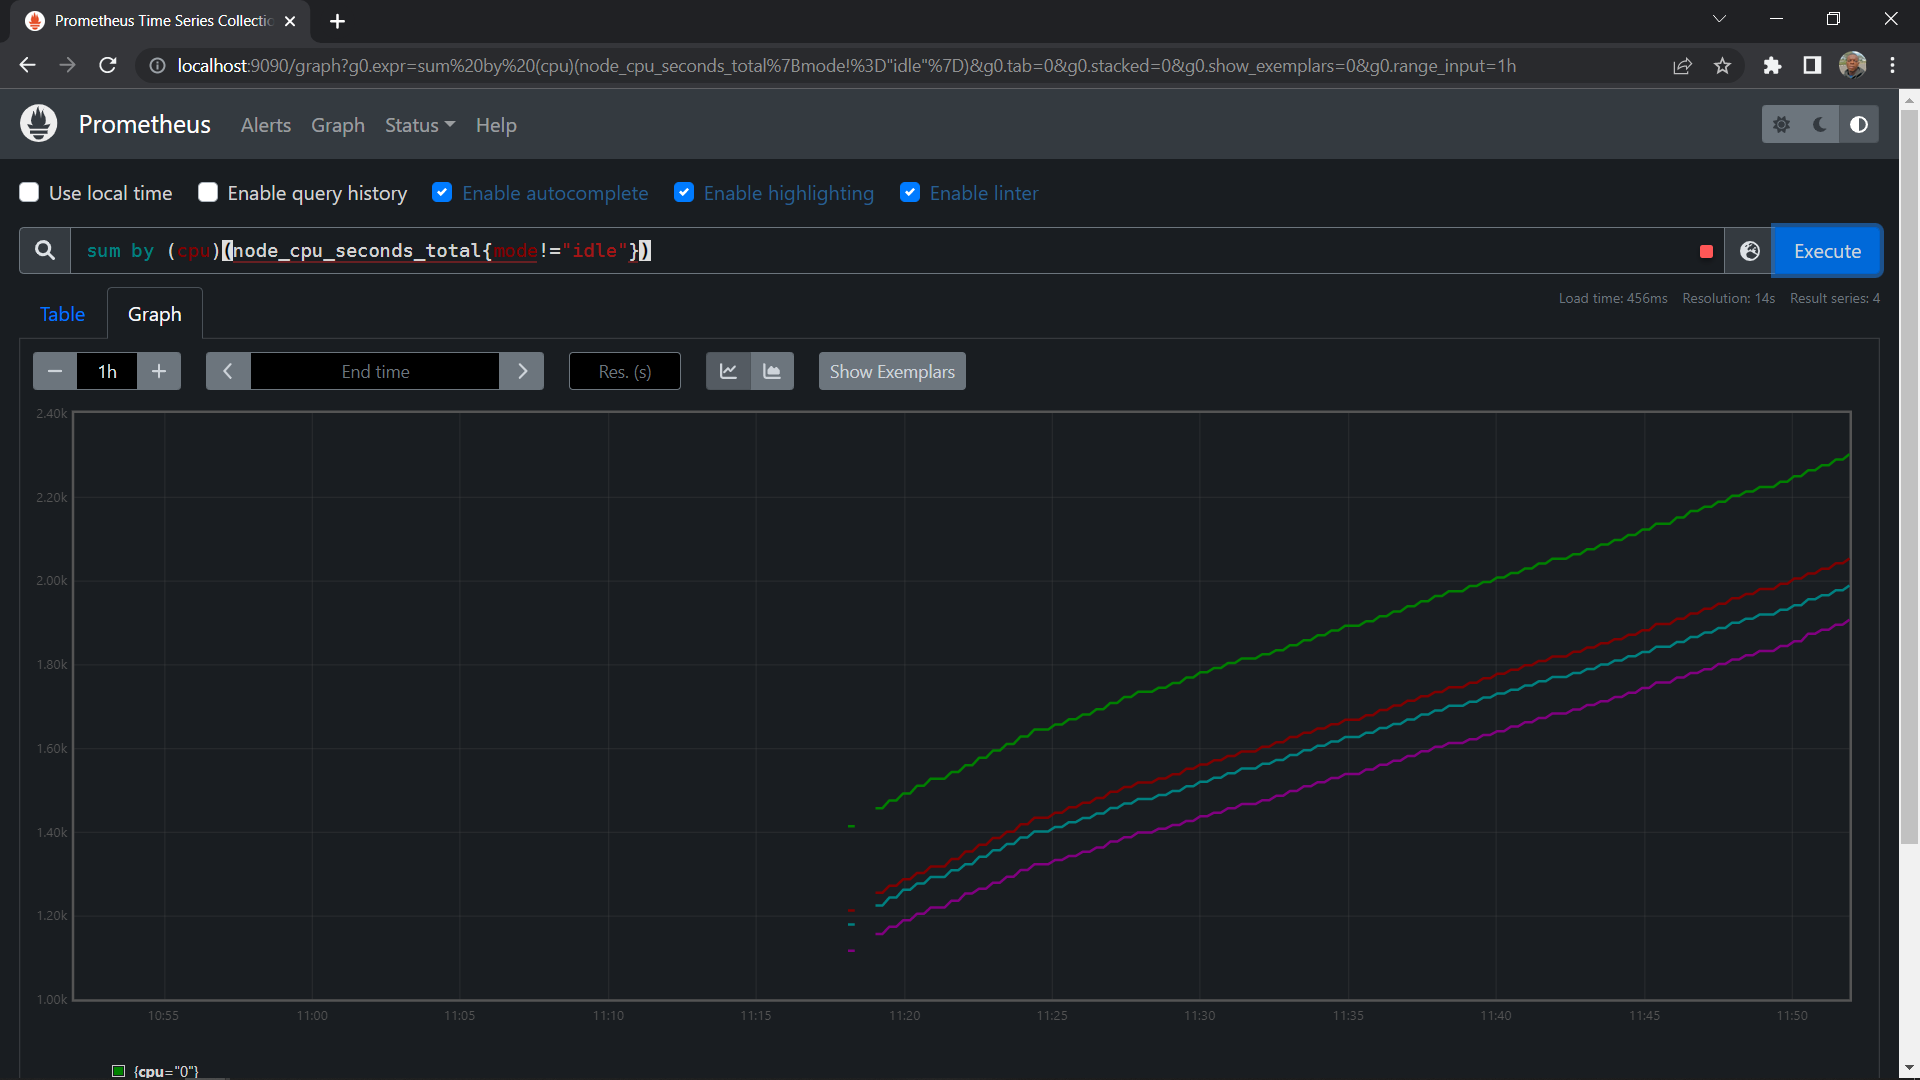
Monitoring and Visualizing with Grafana Dashboards
Prometheus visualization options are limited, only a Graph. Prometheus is great for collecting metrics from targets set as tasks, aggregating the metrics, and storing them locally on the workstation. However, when it comes to traditional resource monitoring adding in Grafana is a great option.
Metrics produced by server components such as node exporter, CoreDNS, and others are collected by Prometheus. Grafana obtains these metrics from Prometheus and displays them in a number of ways.
To get access to the Grafana dashboard we need to get the password and username:
kubectl get secret -n kubernetes-monitoring monitoring-grafana -o yaml$ kubectl get secret -n kubernetes-monitoring monitoring-grafana -o yaml
apiVersion: v1
Data:
admin-password: chjvb51vcGVyYXRvcg
admin-user: YWRtaw4-
kind: secret
metadata
annotations:
meta.heml.sh/release-name: monitoring
meta.heml.sh/release-namespace: kubernetes-monitoring
creationTimestamp: "2022-07-30T11:14:592"
Labels:
app.kubernetes.io/insance: monitoring
app.kubernetes.io/managed-by: Helm
app.kubernetes.io/name: monitoring
app.kubernetes.io/version: monitoring
helm.sh/chart: grafana-6.32.9
name: monitoring-grafana
namespace: kubernetes-monitoring
resourcesVersion: "3966"
vid: 3774e7dd-a294-473e-8482-2bda3769b37a
type: opaqueIf you’re using a Mac or Linux machine, run the following commands to decode the username and password.
echo admin-username | base64 --decode

echo admin-user | base64 --decode
To decode the admin-password and admin-user for windows machines check
The next step is to login into the grafana, firstly you must first direct traffic to the grafana server:
kubectl port-forward svc/monitoring-grafana -n kubernetes-monitoring 3001:80In your browser, go to http://localhost:3001/ or http://YOUR_SERVER_IP:3001/ if you’re running on a cloud machine.
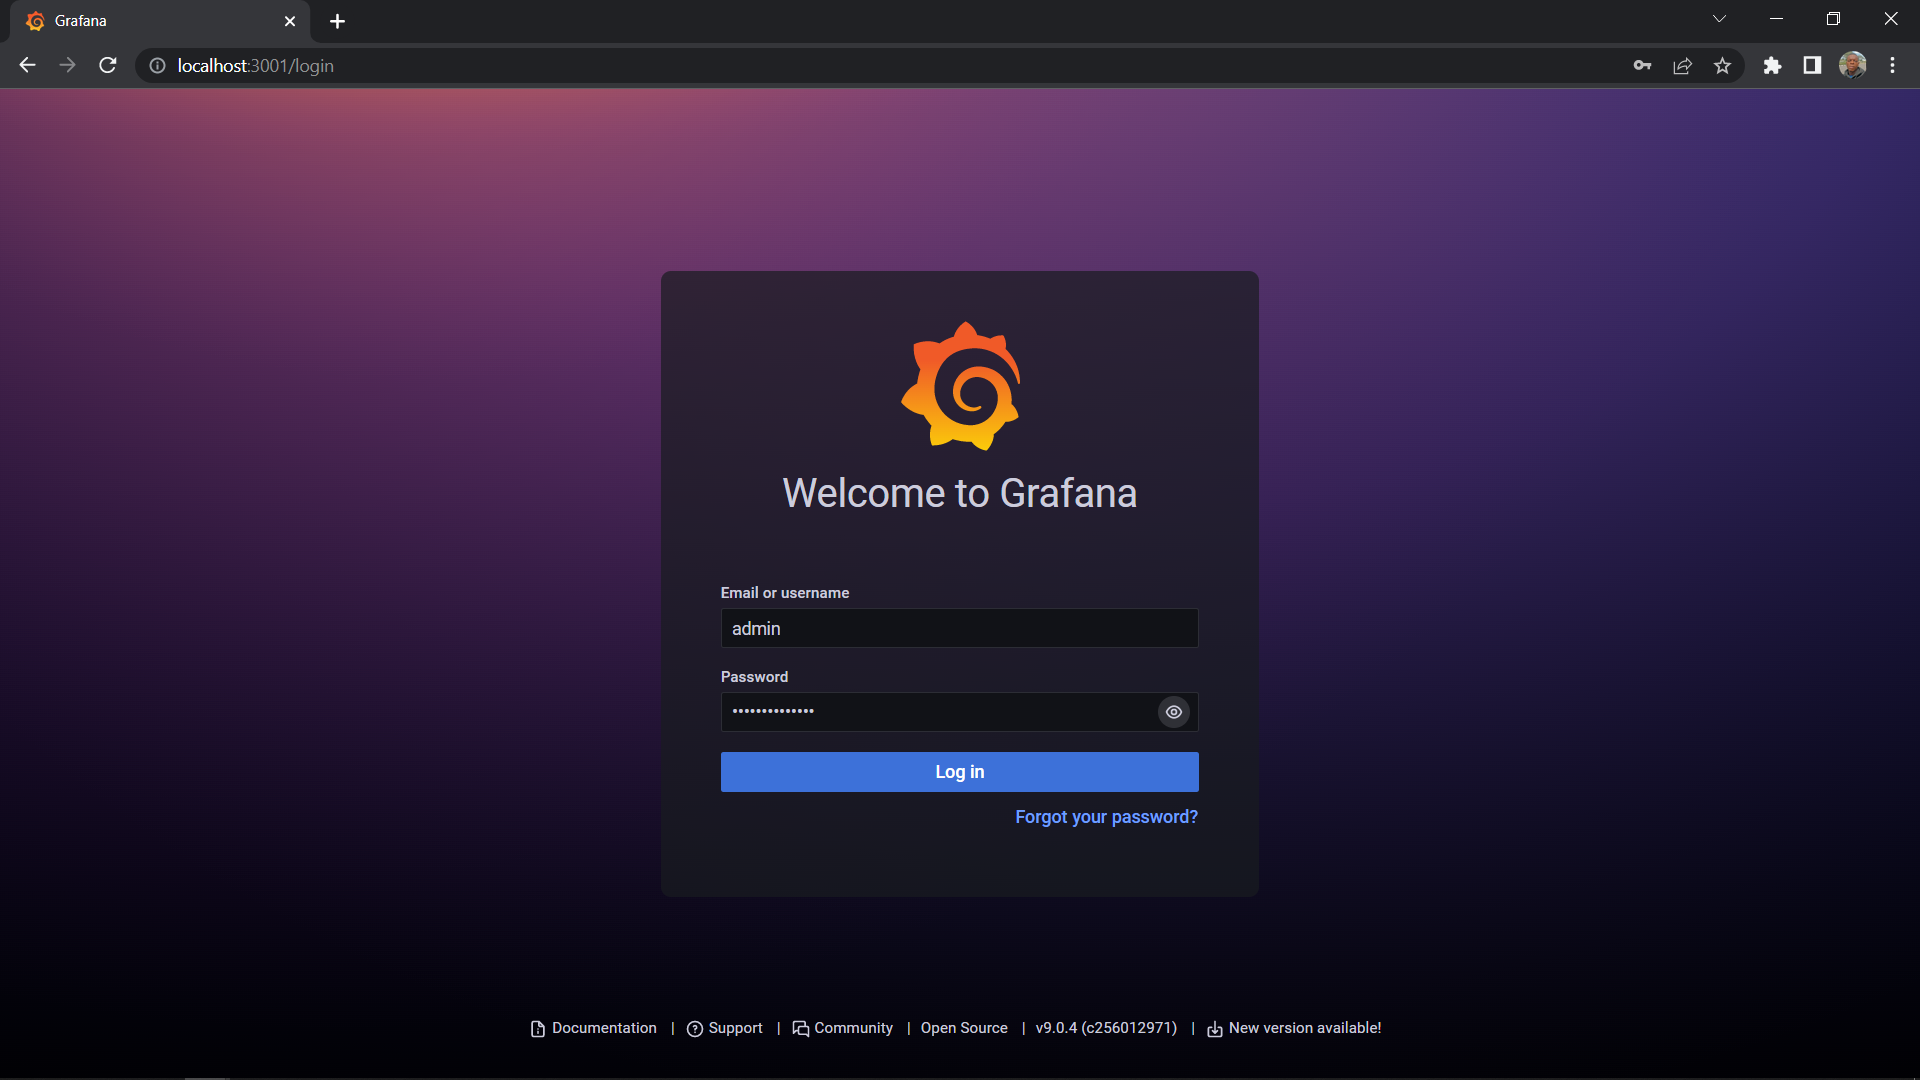
Next type the admin-username and password you have decoded to login.
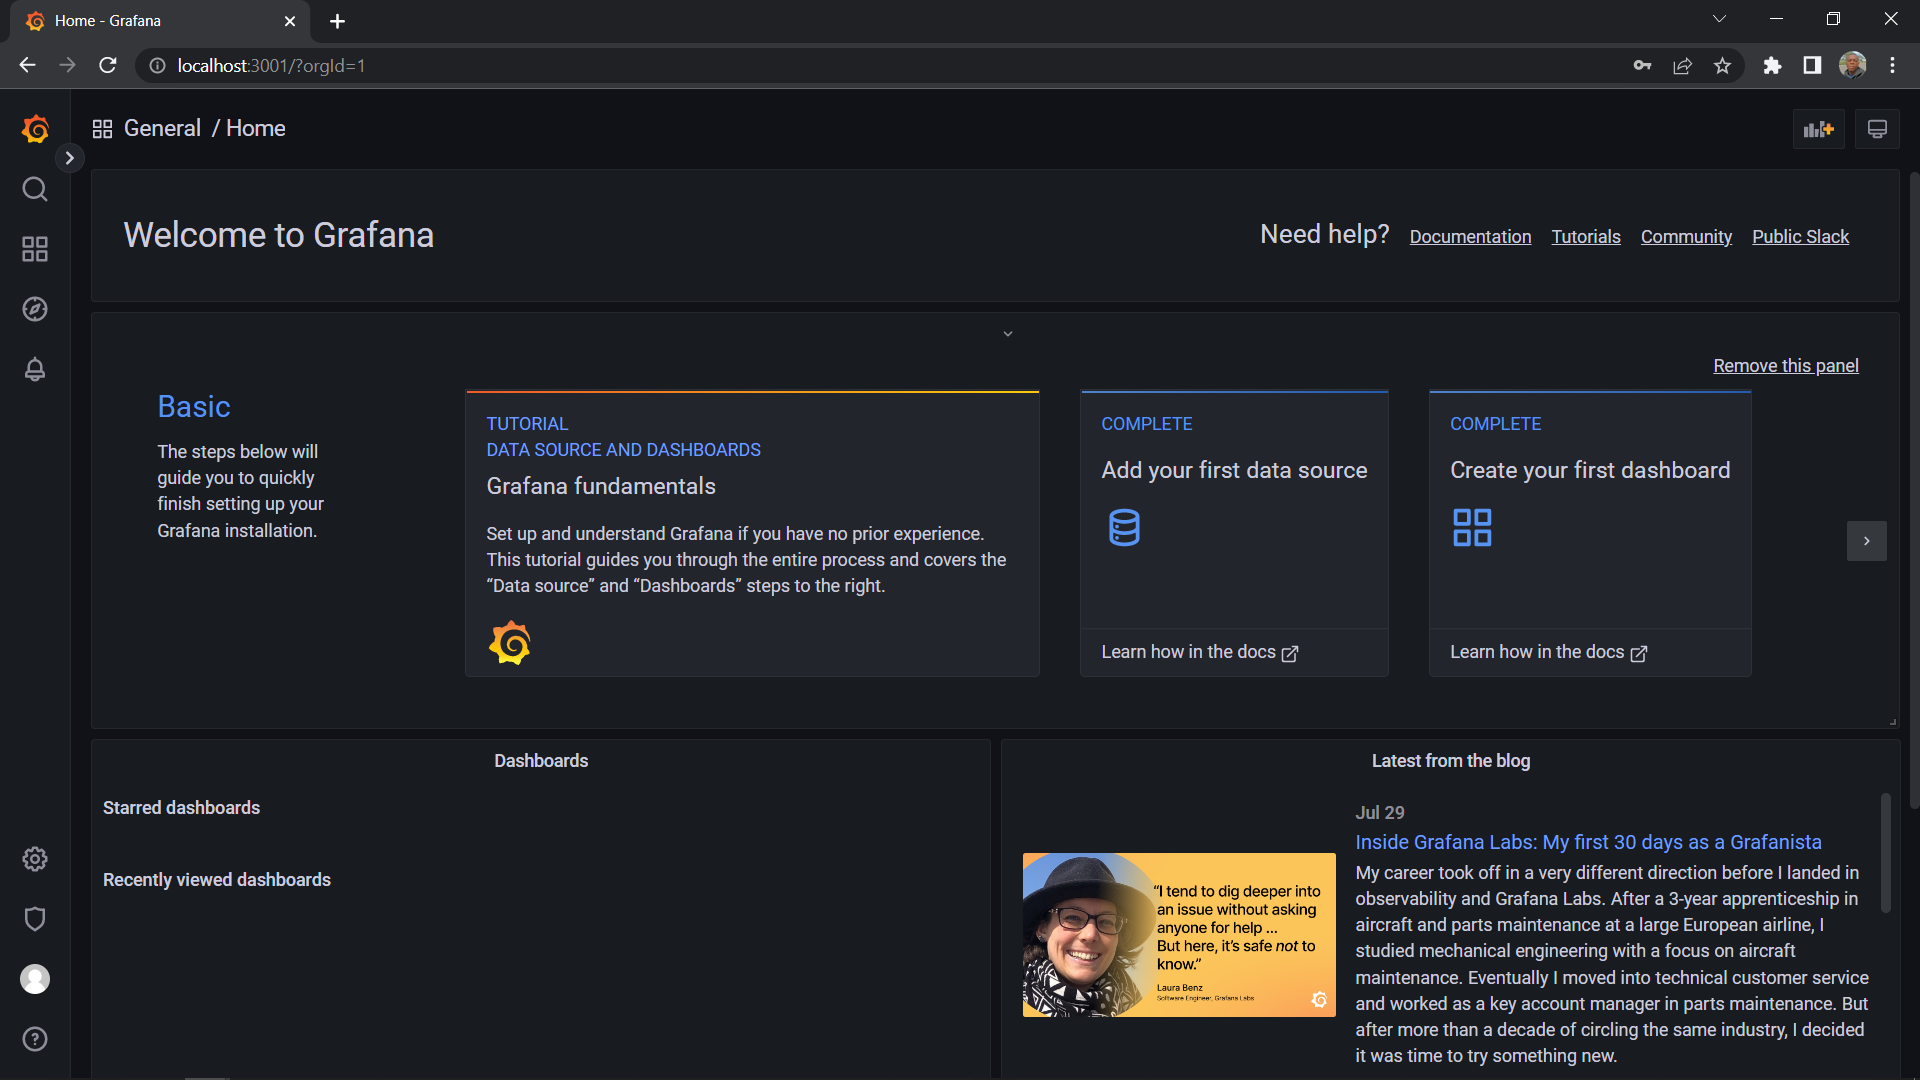
Now to start monitoring, type this URL in your browser type http://localhost:3001/dashboards or http://YOUR_SERVER_IP:3001/dashboards>if you’re using a cloud server.
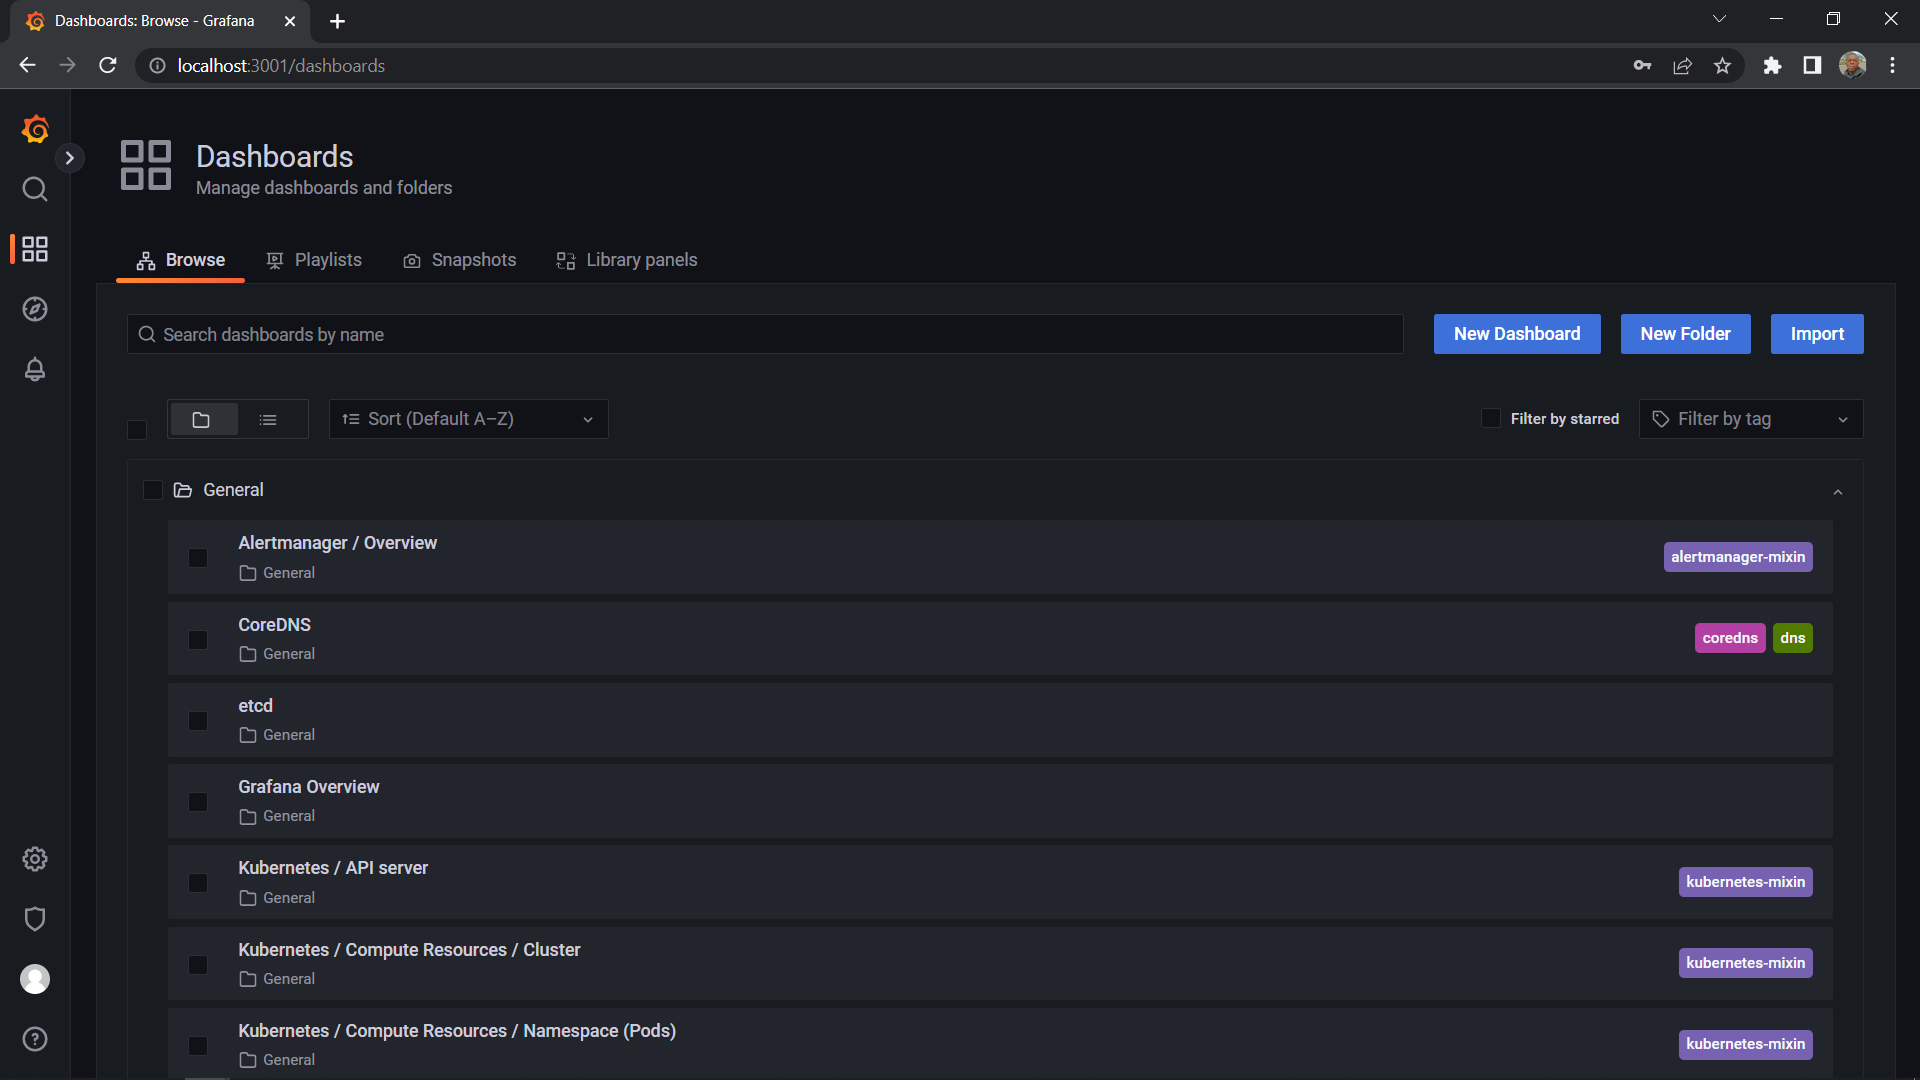
The picture above depicts preconfigured dashboards that come with the Kube-Prometheus stack.
Now click on the kubernetes/compute Resources/ Namespace(cluster)
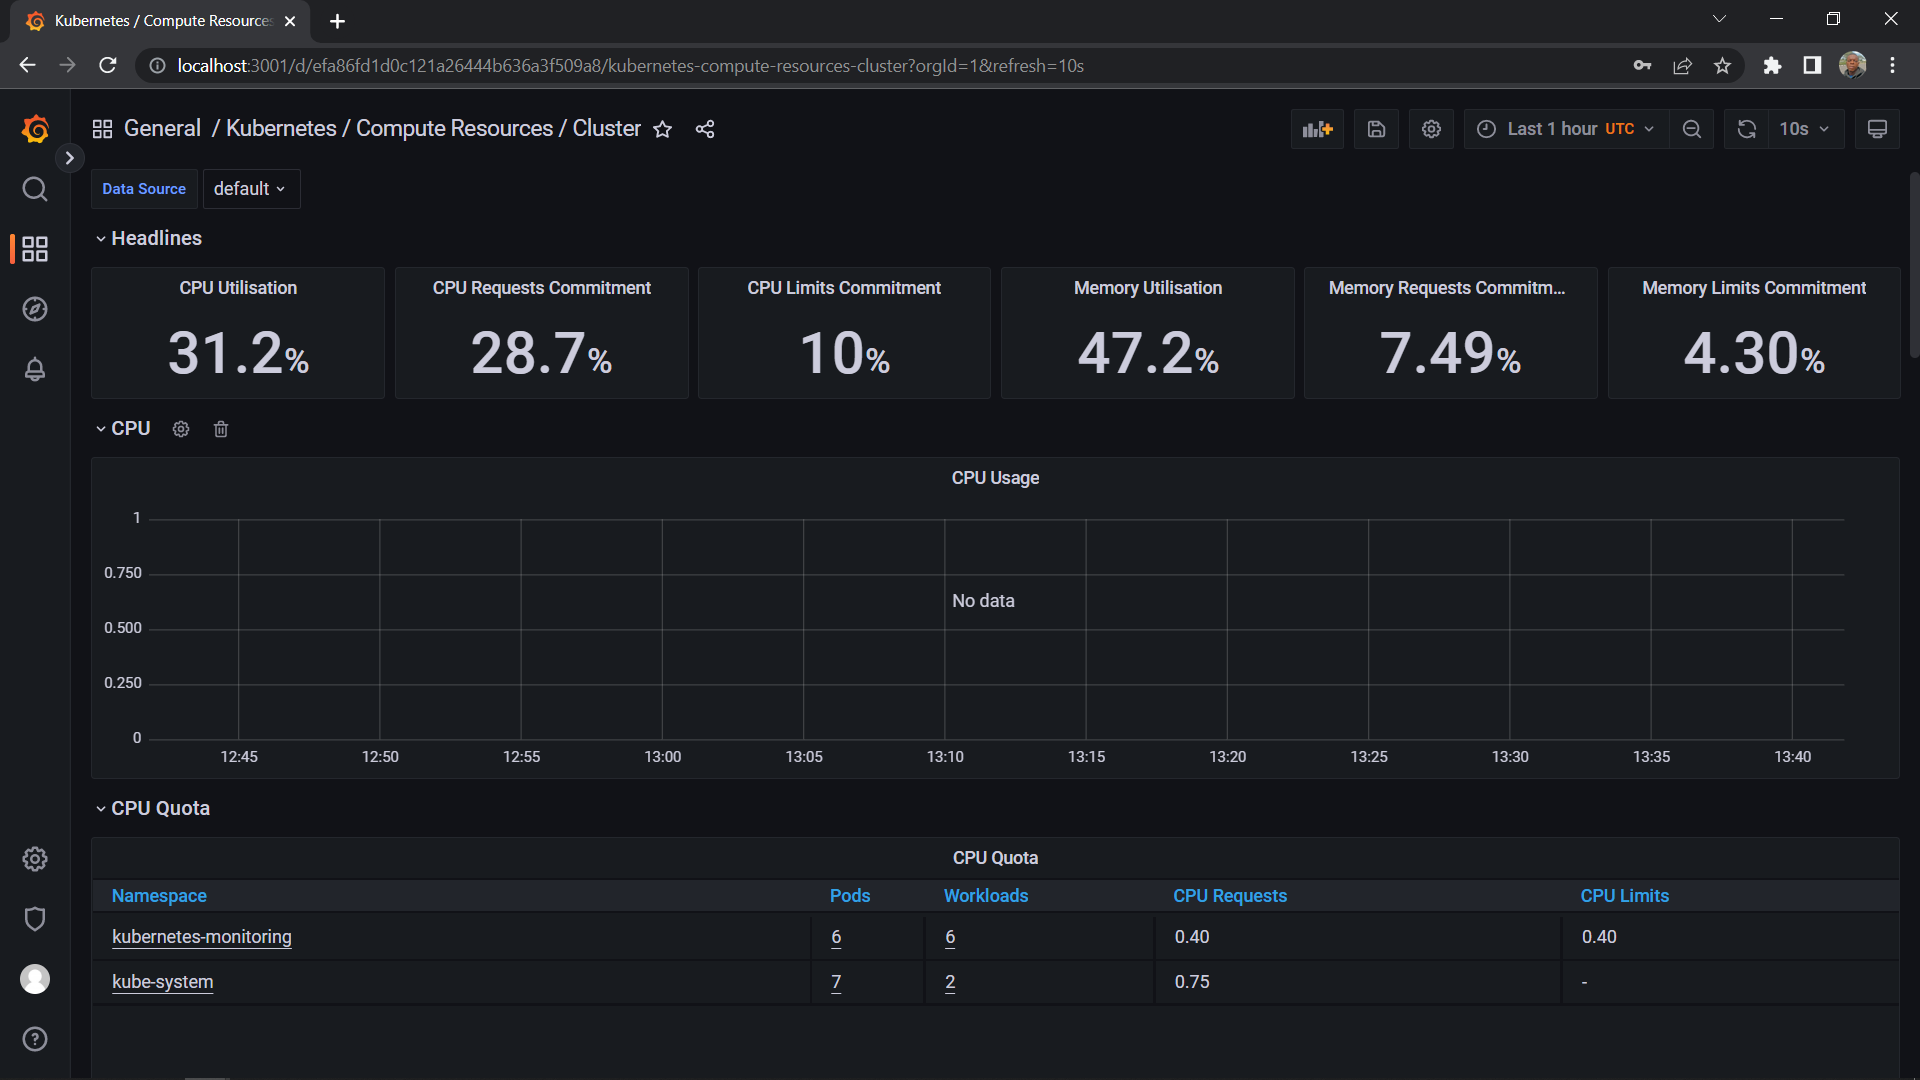
This dashboard shows the CPU usage, CPU request commitment, limitations, memory usage, memory request commitment, and memory limit commitment. It will help you manage and monitor them.
Follow the same steps to select dashboards for Kubernetes resources you want to manage and monitor.
Conclusion
Monitoring your Kubernetes cluster is a smart move and using a Prometheus and Grafana dashboard can make this task much easier. It helps you visualize usage, leading to simpler and more efficient cluster monitoring. If you’re looking to further streamline your processes, particularly in the area of build automation, you might want to check out Earthly. Its containerized approach can significantly speed up your build processes.
Earthly makes CI/CD super simple
Fast, repeatable CI/CD with an instantly familiar syntax – like Dockerfile and Makefile had a baby.


